
Features
- 6-digit display of rate or totalized rate, totalizer flow meter, field scalable
- High accuracy: ±0.005% of span ±1 count
- 0-1 mA, 4-20 mA or 0-10 V analog signal to a frequency of 10 kHz to 110 kHz
- Converts signal input to a scaled rate or totalized rate
- Selectable square root for differential flow
- Output accuracy maintained for narrow or wide spans
- Extracts square root from differential pressure flow transducers & flow totalizer
- All input ranges are user selectable and factory calibrated
- Digital span adjustment: 0 to ±999,999; zero adjustment: -999,999 to +999,999
- Front panel scalable: 0 to ±999,999 for use with current shunts
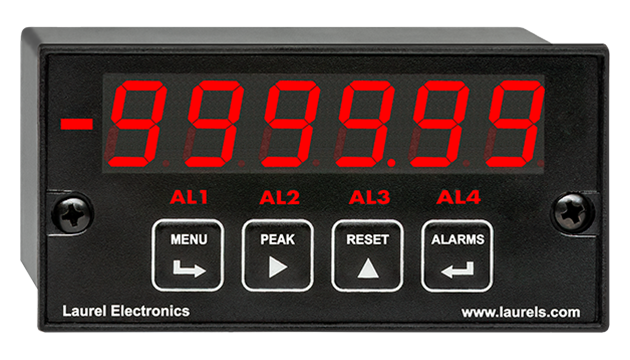
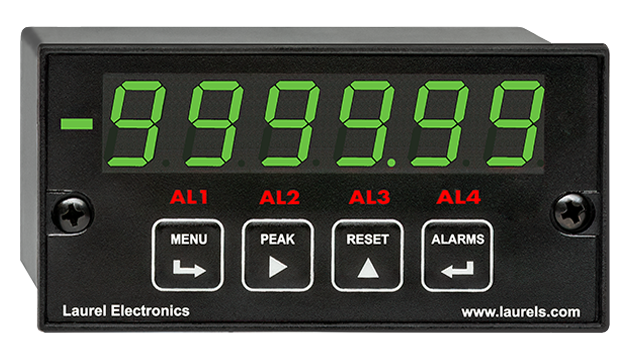
- 1/8 DIN size with bright red or green 0.56" (14.2mm), high LED digits
- Transducer excitation output, 5, 10, 12, or 24 Vdc (isolated)
- Power 85-264 Vac / 90-300 Vdc or 10-48 Vdc / 12-32 Vac (isolated)
- Operating temperature from -40°C to 70°C (-40°F to 158°F)
- Wide choice of Plug-in-Play options:
- 2 or 4 relays, mechanical or solid state, for alarm or control (isolated)
- 1 or 2 Analog output, 4-20 mA, 0-20 mA, 0-10V, or -10V to +10V (isolated)
- Communications: Ethernet, WiFi, USB, RS232, RS485 (isolated)
- Extended DPM allows up to 180 data points for custom curve linearization,
Certificates of Compliance
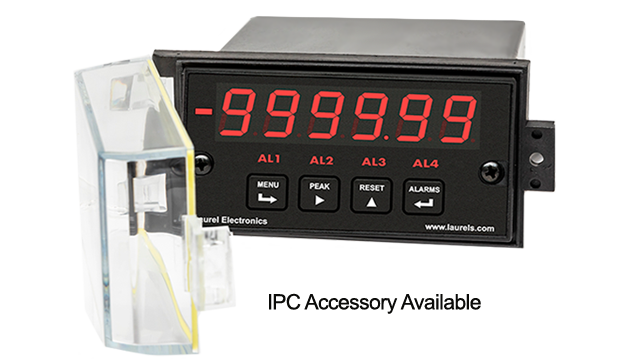
The Laureate™ 1/8 DIN Digital Panel Meter is a six-digit display of rate or total at the push of a front panel key.
A Laureate with the Standard counter main board and a VF voltage-to-frequency signal conditioner board can be scaled to display rate or totalized rate to six digits for 0-1 mA, 4-20 mA or 0-10V analog process signals to a frequency of 10 kHz to 110 kHz. Special input ranges are available from the factory. For example, the display can be scaled to show flow rate in gallons/minute or liters/sec, or to show volume in gallons or liters from the 0-10V output of a flow transducer. Or the display can be scaled to display power consumption in kilowatts or total utilized energy in kilowatt-hours based on the 0-1 mA output of a watt transducer.- Square root extraction is selectable and can be applied to rate or total. This makes the VF Laureate ideal for use with differential pressure flow meters, which have a squared output. Totalized volume is based on linearized rate.
- Accuracy is one of the highest for any digital panel meter: ±0.005% of span ±1 count.
The Laureate Digital Panel Meter is easily programmed with Laurel’s free Instrument Setup Software, downloadable from our website and compatible with Windows PCs, requiring a data interface board for setup.
All signal conditioner board ranges are factory-calibrated, with calibration factors for each range securely stored in an onboard EEPROM. These factors can be scaled via software to accommodate external shunts, enabling field replacement of signal conditioner boards without necessitating recalibration of the associated digital panel meter. For optimal accuracy, factory recalibration is recommended annually. All Laurel Electronics instruments undergo factory calibration using the industry-leading Fluke calibrators, which are recalibrated yearly and certified traceable to national standards, ensuring the highest level of precision and reliability.
Extended DPM Counter Version
- Batch control based on linearized total. A Laureate VF meter with the Extended counter main board can totalize linearized flow from an analog rate signal, and also count up to a preset value, or count down to zero from a preset value for batch control. Operation as a batch controller requires the dual-relay output board option. One of the relays is dedicated to ON/OFF batch control. The other relay is available to slow down rate near the setpoint or to provide another alarm or control function based on rate or total.
- Custom Curve Linearization. For custom curve linearization, up to 180 data points can be input into a spreadsheet or text file by the user. The computer then calculates spline-fit segments, which are downloaded into the digital panel meter via RS232. The Extended VF meter can linearize and display analog inputs based on a custom curve, for instance to read out the volume of an irregularly shaped tank based on level or pressure, or to linearize a nonlinear transducer. Custom-linearized rates can also be totalized and be used for batch control.
- Time Based on Rate. The Extended VF meter can display a time inversely proportional to measured rate, such as the time that it will take a conveyor to traverse an oven. As the rate of the conveyor is increased, the displayed baking time is decreased.
Principles of V-to-F Operation
The V-to-F signal conditioner board converts the full-scale 0-1 mA, 4-20 mA or 0-10 V analog signal to a frequency of 10 kHz to 110 kHz. This frequency is determined by measuring period over a selected gate time (from 10 ms to 200 s) and taking the inverse of period. Selecting a short gate time provides a much higher update rate than conventional counting-type frequency meters. At the lowest frequency of 10 kHz and the minimum gate time of 10 ms, the digital panel meter is capable of 25 updates per second. Scaling to rate in engineering units and totalizing are done mathematically. Totals are calculated as the product of rate and time in seconds regardless of the selected gate time. Totals are stored in nonvolatile memory in case of power loss.
High Resolution Display
The display of rate or total may be scaled to ±999,999. The two least-significant digits may be set to display zero with rounding or be active digits. Noise in rate readings can be reduced by selecting a longer gate time. In addition, an adaptive digital filter can reduce variations due to noise while rapidly responding to actual changes in signal level.
Digital signal filtering modes can be selected to ensure stable readings in electrically noisy environments.
- An unfiltered selection provides true peak and valley readings and aids in control applications.
- A batch average filter selection averages each 16 conversions.
- An adaptive moving average filter selection provides a choice of 8 time constants from 80 ms to 9.6 seconds. When a significant change in signal level occurs, the filter adapts by briefly switching to the shortest time to follow the change, then reverts back to its selected time constant. An Auto setting selects the time constant selection based on signal noise.
Peak and valley values are automatically captured. These may be displayed via a front panel pushbutton command or control signal at the rear connector, or be transmitted as serial data.
Two rear panel control Inputs (CMOS/TTL levels, logic 0 = tied to digital ground, logic 1 = open) or dry contacts that can be set to control / activate 14 meter commands.
An (isolated) 5, 10, 12, or 24 Vdc excitation output is standard to power transducers or two-wire transmitters. Ratiometric operation, which automatically compensates for changes in the applied excitation, is jumper selectable for applications, such as bridges, where the signal to be measured is proportional to the excitation level.
| Display | |
|---|---|
| Readout | 6 LED digits, 7-segment, 14.2 mm (.56") |
| Color | Red or green LED |
| Range | -999,999 to +999,999 |
| Indicators | Four LED lamps |
| Inputs | |
| Standard signal levels | 4-20 mA, 0-1 mA, 0-10V (jumper selectable) |
| Input resistance | 50Ω at 4-20 mA, 1.00 kΩ at 0-1 mA, 1.01 MΩ at 0-10V |
| Other signal levels | Consult factory |
| Recalibration: All ranges are calibrated at the factory. Recalibration is recommended every 12 months. | |
| Conversion | |
| Frequency Technique | Inverse period |
| Update Rate | Gate time + 30 ms (max) |
| Gate Time | Selectable 10 ms to 199.99 s |
| Accuracy | |
| Span tempco | ±0.003% reading/°C |
| Zero tempco | ±0.003% FS/°C |
| Accuracy at 25°C | ±0.01% FS ± 1 count |
| Power Supply Boards (one required) | |
| Voltage, standard | 85-264 Vac or 90-300 Vdc |
| Voltage, optional | 12-32 Vac or 10-48 Vdc |
| Frequency | DC or 47-63 Hz |
| Power consumption (typical, base meter) | 1.2W @ 120 Vac, 1.5W @ 240 Vac, 1.3W @ 10 Vdc, 1.4W @ 20 Vdc, 1.55W @ 30 Vdc, 1.8W @ 40 Vdc, 2.15W @ 48 Vdc |
| Power Isolation | 250V rms working, 2.3 kV rms per 1 min test |
| Excitation Output (standard) | |
| 5 Vdc | 5 Vdc ± 5%, 100 mA (jumper selectable) |
| 10 Vdc | 10 Vdc ± 5%, 120 mA (jumper selectable) |
| 12 Vdc | 12 Vdc ± 5%, 100 mA (jumper selectable) |
| 24 Vdc | 24 Vdc ± 5%, 50 mA (jumper selectable) |
| Output Isolation | 50 Vdc from signal ground |
| Analog Output Boards (one optional) | |
| Output levels | 4-20 mA, 0-20 mA, 0-10V, -10 to +10V (single-output option) |
| 4-20 mA, 0-20 mA, 0-10V (dual-output option) | |
| Current compliance | 2 mA at 10V ( > 5 kΩ load) |
| Voltage compliance | 12V at 20 mA (< 600 Ω load) |
| Scaling | Zero and full scale adjustable from -99999 to +99999 |
| Resolution | 16 bits (0.0015% of full scale) |
| Isolation | 250V rms working, 2.3 kV rms per 1 min test |
| (dual analog outputs share the same ground) | |
| Relay Output Boards (one required for batch control) | |
| Dual magnetic relays | 2 Form C, 10A max, 440Vac or 125Vdc max, 2500VA or 300W |
| Quad magnetic relays | 4 Form A (NO), 10A max, 440Vac or 125Vdc max, 2500VA or 300W |
| Dual solid state relays | 2 Form A (NO), AC or DC, 0V - 400V, 120Ma, 35Ohms (max at On-State) |
| Quad solid state relays | 4 Form A (NO), AC or DC, 0V - 400V, 120Ma, 35Ohms (max at On-State) |
| Relay commons | Isolated commons for dual relays or each pair of quad relays |
| Relay isolation | 250V rms working, 2.3 kV rms per 1 minute test |
| Relay latching modes | Latching or non-latching |
| Relay active modes | Active on or off, active high or low |
| Hysteresis modes | QA passband mode, split hysteresis, span hysteresis |
| Communication Boards (one optional) | |
| Board selections | RS232, RS485 with dual RJ11 connectors, RS485 with dual RJ45 connectors, USB, Ethernet, USB-to-RS485 gateway, Ethernet-to-RS485 gateway, WiFi with built-in antenna plus USB & RS485, WiFi with external antenna plus USB & RS485 |
| Protocols | Laurel Custom ASCII (serial), Modbus RTU (serial), Modbus TCP (Ethernet or WiFi) |
| Digital addresses | 247 (Modbus), 31 (Laurel ASCII), |
| Isolation | 250V rms working, 2.3 kV rms per 1 min test |
| Environmental | |
| Operating temperature | -40°C to 70°C (-40°F to 158°F) |
| Storage temperature. | -40°C to 85°C (-40°F to 185°F) |
| Relative humidity | 95% at 40°C, non-condensing |
| Protection | NEMA-4X (IP-65) when panel mounted |
| Electrical Connections | |
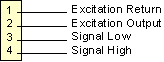 |
|
| Mechanical | |
| Enclosure | 1/8 DIN, high impact plastic, UL 94V-0, color: black |
| Mounting | 1/8 DIN panel cutout required: 3.622" x 1.772" (92 mm x 45 mm). |
| Dimensions | 4.68" x 2.45" x 5.64" (119 mm x 62 mm x 143 mm) (W x H x D) |
| Maximum panel thickness | 4.5 mm (0.18") |
| Tightening Torque - Connectors | Screw terminal connectors: 5 lb-in (0.56 Nm) |
| Tightening Torque - Pawls | Digital Panel Meter Case Pawls: 5 lb-in (0.56 Nm) |
| Weight of base meter | 210 g (7.4 oz) typical (DPM, counter, timer, 6-digit remote display) |
| Weight of option boards | 30 g (1.0 oz) typical per board (analog output, relay output, communications) |
| General | |
| Programming Methods | Four front panel buttons or via Laurel's free Instrument Setup Software, which runs on a PC under MS Windows. |
| Security | Lockout options include using the front panel buttons, the free Instrument Setup Software, or a hardware jumper. |
| Warranty | 3 years parts & labor |
| Recalibration: All ranges are calibrated at the factory. Recalibration is recommended every 12 months. | |
Free Instrument Setup Software for Series 2 Laureates
|
|
| 1/8 DIN Digital Panel Meters | DIN Rail Transmitters |
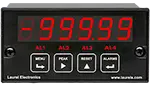
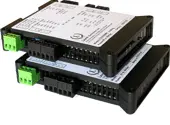
Free Downloadable Windows-based Instrument Setup (IS) software (Data Interface Board Required) for use with our programmable Digital Panel Meters, Scale Meters, Counters, Timers, Remote Displays, and Transmitters, are an easy method to set up Laureate 1/8 DIN digital panel meters, counters, timers, remote displays, and DIN-rail transmitters, as explained in the Instrument Setup Software Manual. Laureate 1/8 DIN instruments can also be set up from the front panel, as explained in their respective Owners Manuals. Instrument Setup software is of benefit whether or not the PC is connected to the instrument.
- When the PC is connected to the instrument, Instrument Setup software can retrieve the setup file from the instrument or open a default setup file or previously saved setup file from disk View Setup, then provides graphical user interface (GUI) screens with pull-down menus applicable to input, display, scaling, filtering, alarms, communications, analog output, and front panel lockouts. Fields that are not applicable to the instrument as configured are either left out or grayed out. Clicking on any item will bring up a detailed Help screen for that item. After editing, the setup file can be downloaded, uploaded to the instrument, or saved to a disk. The same setup file can then be downloaded into multiple instruments.
- When the PC is not connected to the instrument, the above GUI screens can be used to set up a virtual instrument. The setup file can then be saved to disk. Switching toView Menu then brings up a screen with the required front panel programming steps. This view can be printed out for use at the instrument site and to serve as a hard copy record.
Download Free Instrument Setup Software
Installation
Set User Account Control (UAC) of MS Windows to "Never notifiy me" so that Instrument Setup Software can create directories. The UAC change screen can be reached as follows:
- Under Windows 7, click on the Windows Start button in the lower left of the desktop and enter "UAC" in the search field.
- Under Windows 8, navigate to Control Panel, then to the "User Accounts and Family Safety" section, and click on "Change User Account Control Settings."
- Under Windows 10, click on the Windows Start button in the lower left of the desktop, then on "Settings", and enter "UAC" in the search field.
- Reboot your computer for the changed UAC setting to take effect.
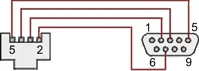
RJ11-to-DB9 cable with rear view of DB9 connector to PC
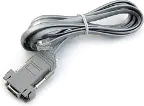
RS232 cable, meter to PC, P/N CBL01
Laureate 1/8 DIN Laureate instruments must be equipped with a serial communications board and be connected to the computer via a serial communications cable. The connection can be via RS232, RS485, USB or Ethernet. Following setup, the serial communications board may be removed from the instrument if desired. The wiring of the RS232 cable is illustrated above with end views of the two connectors.
Laureate LT Series transmitters come standard with a 3-wire serial interface, which can be jumpered for RS232 or RS485.
Laureate LTE Series transmitters come standard with an Ethernet interface.
Meter Setup Screens
Click on any of the reduced screens below for a full-size screen view, then click on the Back button of your browser to return to this page. The screens examples below are for a fully-loaded Series 2 Digital Panel Meter (DPM), which is connected to the PC via RS232. If the meter is a Series 1 meter (pre-2007), this is sensed by the software, and somewhat different screens are brought up. Please see Series 1 setup screens.

Welcome Screen
From the computer desktop, click on Start > Programs > IS2 > IS2. Or click on the IS icon on your desktop. This splash screen will be displayed for three seconds. The software revision number is in the lower right.


Communications Selection Screen
Specify your desired communication protocol and the serial communications bus type, which should match the jumper setup of the instrument. Select None if the PC is not connected to the instrument.

Establish Communications Screen
If you selected RS-232, you will be asked to specify the PC Com Port and Baud Rate, which should match the jumper setup of the instrument. Click on Establish. With the right settings, the Communications Established field will light up in green, and the Meter Type will be recognized. If so, click onMain Menu.

Main Menu Screen
Click on File > Default Setup to retrieve the default setup file from disk for your type of meter. Click on File > Open Setupto retrieve a previously saved setup file from disk or on File > Save Setup to save your edited setup file to disk. Click onDPM > Get Setup to retrieve the setup file from your meter or on DPM > Put Setup to download your edited setup file into the meter.

DPM Input + Display Setup Screen
From the Main Menu, click on View > Setup, then on theInput+Display tab. You can now specify the meter hardware, signal type, display mode, and functions of control inputs A and B. Clicking on any item brings up a pull-down menu with the available choices.

DPM Scaling Setup Screen
Click on the Scaling tab, which provides three scaling methods to relate the signal to the displayed reading: 1) Scale and Offset method, 2) Coordinates of two points method, and 3) Reading Coordinates of Two Points method. The last method uses actual high and low signals, and the computer will prompt you.

DPM Filter Setup Screen
Click on the Filter tab, which allows you to specify the digital filter time constant (if any), the adaptive filter threshold, and whether Peak / Valley values are filtered or unfiltered. As for all setup screens, clicking on the F1 key while an item is highlighted brings up a Help screen for that item, as illustrated.

DPM Relay Alarms Setup Screen
Click on the Relay Alarms tab, which allows you to set up Alarms 1 and 2 for the optional dual relay output board. Clicking on any of the four numeric fields changes these to green and brings up a special field to enter the desired numeric value, which is tied to the displayed reading.

DPM Communications Setup Screen
Click on the Communications tab so set up serial communications. In particular, you can special the Serial Protocol and the meter address if multiple meters are to be addressed on the same serial data line.

DPM Analog Output Setup Screen
Click on the Analog Out tab so set up the optional analog output board. Three output ranges are selectable, the endpoints of which can be tied to user-specified High and Low readings.

DPM Lockouts Setup Screen
Click on the Lockouts tab to check off menu items which will no longer be accessible from the front panel of the meter. This will simplify meter operation and prevent unintended setup changes.
Meter Setup Utilities

DPM Front Panel Setup Screen
As an aid to programming the meter from the front panel when a serial connection is not available, you can return to the Main Menu and click on View > Menu. The required sequence of front panel screens will then be displayed. Click on any step in the sequence for the meaning of each digit, as illustrated for the FILtEr step. For a hardcopy, simply press on Print.

DPM Jumper Setup Screen
Specify your desired communication protocol and the serial communications bus type, which should match the jumper setup of the instrument. Select None if the PC is not connected to the instrument.

DPM Jumper Setup Screens
Click on any of the displayed plug-in boards, and you will be presented with the jumper positions and electrical connections for your selected board. This minimizes the need to refer to the printed manual.

DPM Commands Screen
This page allows you set up external input, serial communications, an analog output proportional to the display (optional), and lockouts for Laureate digital counters. The grayed out area at the top right of the screen applies to Laureate remote displays.


Graphical Output Screens (not available with Ethernet)
From the Main Menu, click on Readings if your PC is connected to the meter. A pull-down menu then offers three choices: List, Plot and Graph.
- List presents the latest readings in a 20-row by 10-column table. Press Pause at any time to freeze the display. This is one method to capture peak readings.
- Plot generates a plot of readings vs. time in seconds. It effectively turns the DPM-PC combination into a printing digital oscilloscope.
- Graph generates a histogram where the horizontal axis is the reading and the vertical axis is the number of occurrences of readings. The display continually resizes itself as the number of readings increases.

DPM Calibration Screens
Click on the Scaling tab, which provides three scalClick on the Scaling tab, which provides three scaling methods to relate the signal to the displayed reading: 1) Scale and Offset method, 2) Coordinates of two points method, and 3) Reading Coordinates of Two Points method. The last method uses actual high and low signals, and the computer will prompt you.

Frequency Meter Calibration Screen
Calibration of the quartz crystal of the Laureate frequency meter requires the input of a known frequency from a calibrator. Apply the frequency, then enter the frequency in Hertz. Calibration will be automatic, with storage of the calibration factor stored in non-volatile memory.
Laureate™ 1/8 DIN Case For Laureate Digital Panel Meters, Counters, Timers & Remote Displays
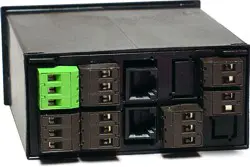
Key Features
- Meets 1/8 DIN Standard.
- Installs from front of panel.
- Short depth behind the panel: only 4" (102 mm) plus connectors.
- Understated 0.157" (4 mm) thick bezel.
- Meets NEMA 4X (IP-65) for high-pressure wawshdon when panel mounted.
- Screw clamps connectors meet VDE / IEC / UL / CSA safety standards.
- Rugged GE Lexan® housing material.
- Safety certified per EN 61010-1.


Dimensions
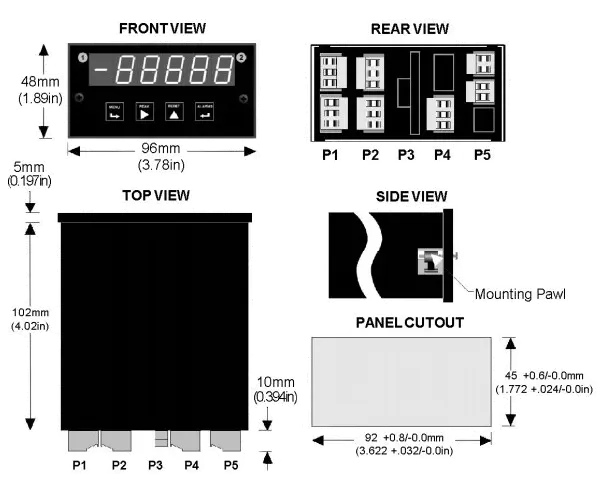
Maximum panel thickness: 4.5 mm (0.18")
Weight of base meter: 210 g (7.4 oz) typical (DPM, counter, timer, 6-digit remote display)
Weight of option boards: 30 g (1.0 oz) typical per board (analog output, relay output, communications)
Tightening Torque - Connectors: Screw terminal connectors: 5 lb-in (0.56 Nm)
Tightening Torque - Pawls: Digital Panel Meter Case Pawls: 5 lb-in (0.56 Nm)
Dimensioned CAD assembly drawings in EPRT, STEP, x_t. dwg, pdf file formats: Laureate-meter-case.zip (zipping prevents browser from opening CAD files as text files).
Panel Mounting
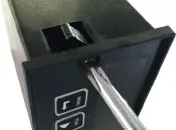 Slide the meter into a 45 x 92 mm 1/8 DIN panel cutout. Ensure that the provided gasket is in place between the front of the panel and the back of the meter bezel.
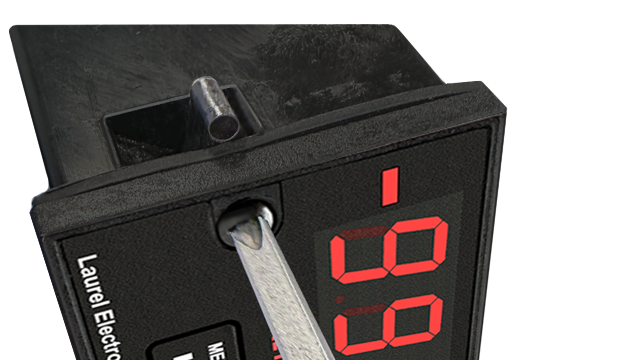
The meter is secured by two pawls, each held by a screw, as illustrated. Turning each screw counterclockwise extends the pawl outward from the case and behind the panel. Turning each screw clockwise further tightens it against the panel to secure the meter.
Slide the meter into a 45 x 92 mm 1/8 DIN panel cutout. Ensure that the provided gasket is in place between the front of the panel and the back of the meter bezel.
The meter is secured by two pawls, each held by a screw, as illustrated. Turning each screw counterclockwise extends the pawl outward from the case and behind the panel. Turning each screw clockwise further tightens it against the panel to secure the meter.
Turning each screw counterclockwise loosens the pawl and retracts it into its well. This position allows installed meter to be removed from their panel, or new meters to be installed in a panel. Do not remove the screws from their pawls. Doing so would cause the screw and pawl to fall off and likely get lost. Do not overtighten so as not to damage the plastic parts.


| Flow from a Differential Pressure Transducer | |
|---|---|
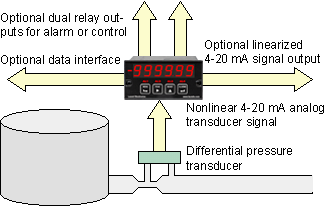 |
An ideal application for the Standard Laureate VF meter: readout of flow based on the 4-20 mA analog signal from a differential pressure transducer. Options include dual relays for alarm or control, isolated analog output to turn the meter into a transmitter, and RS232/485 data communications.s |
| Up- or Down-Counting Batch Controller | |
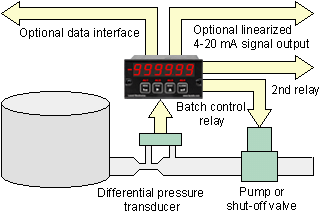 |
An ideal application for the Extended Laureate VF meter: up- or down-counting batch controller. The dual-relay card is required. One relay is dedicated to batch control, the other relay is available to alarm the rate or total. The signal input can be linear or nonlinear. The display can be toggled between rate and total. |
| Volume of an Irregularly-Shaped Tank | |
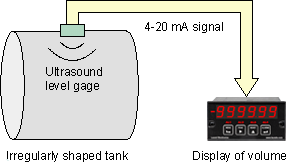 |
The Extended Laureate VF meter can linearize analog signals for display and alarm using custom curve linearization with multiple nonlinear segments. As illustrated, tank level is measured by an ultrasound detector, which transmits a 4-20 mA signal. This signal is then converted to a highly accurate volume reading. Linearized readings can also be totalized. |
| Process Time from an Analog Rate Signal | |
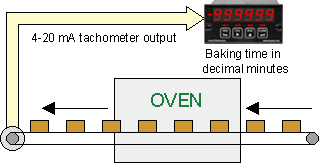 |
A unique application of the Extended Laureate VF meter is displaying process time based on the 4-20 mA or 0-10 V signal from a rate meter. In this example, a tachometer transmits the speed of a conveyer belt through an oven. The meter displays baking time in the oven using the mathematical relationship time = distance / speed. |
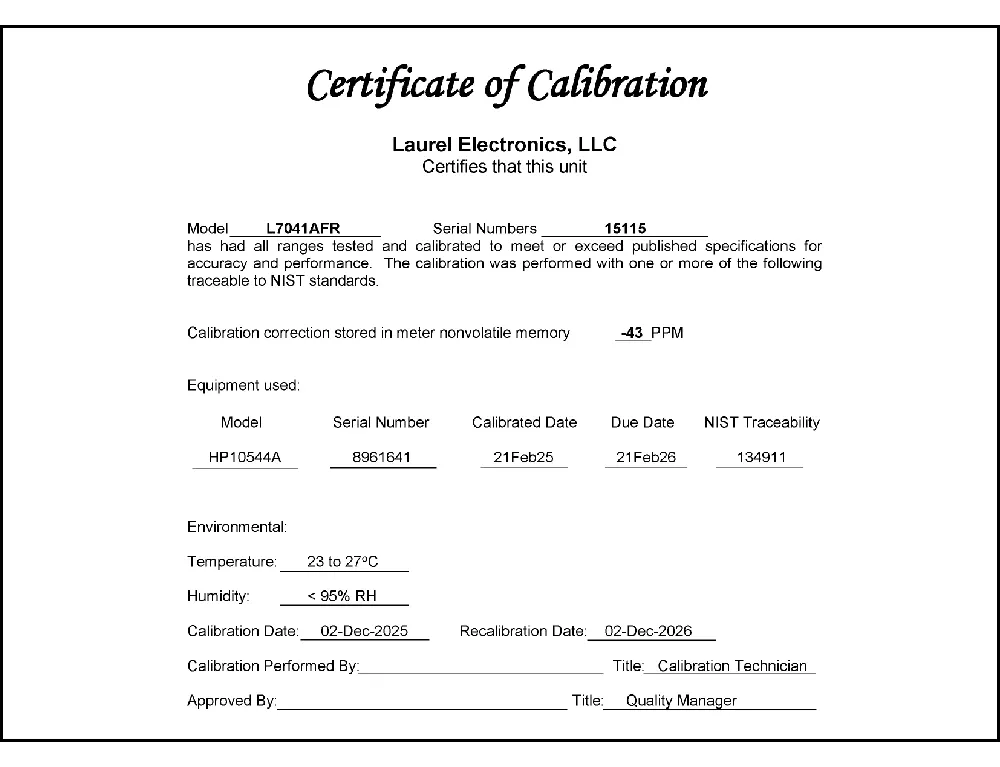
CAL-Digital
Certificate of Calibration
$65.00
DLS-XLOG2
XLog2 Data logging Software
$495.00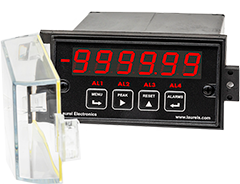
IPC
Digital Panel Meter Splashproof Cover
$55.00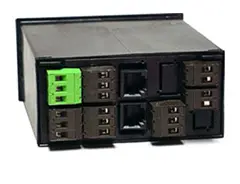

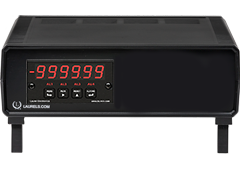
CASE1
Digital Panel Meter Benchtop Case1
$150.00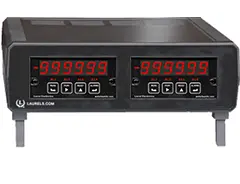
CASE2
Digital Panel Meter Benchtop Case2
$150.00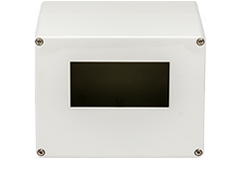
BOX1
DPM Enclosure Nema-4x Box1
$180.00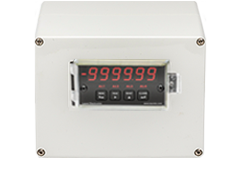
BOX2
DPM Enclosure Nema-4x BOX2
$230.00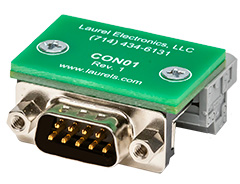
CON01
CON01 Connector
$75.00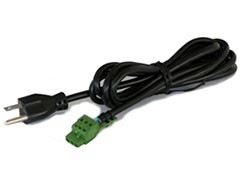
CBL6
6-foot Power Cable
$41.00CBL12
12-foot Power Cable
$47.00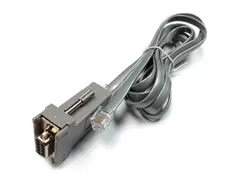
CBL01
RS232 Cable for Meters
$35.00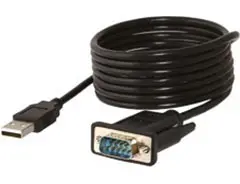
CBL02
USB-to-RS232 Adapter Cable
$47.00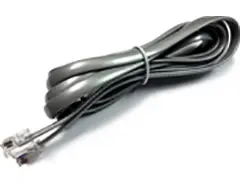
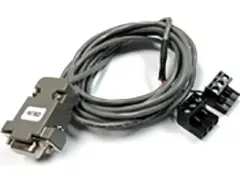
CBL04
RS232 Cable for LT Transmitters
$47.00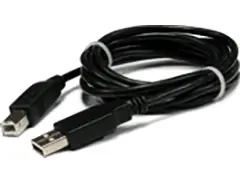
CBL05
USB Data Cable for Meters
$47.00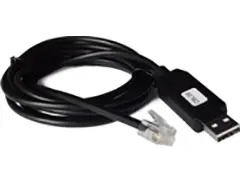
CBL06
USB-to-RS485 Adapter Cable
$47.00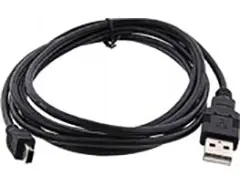
CBL07
USB Programming & Data Cable
$47.00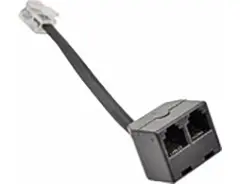
CBL08
RS485 Splitter Cable
$33.00Modular Design for Maximum Flexibility at Minimum Cost
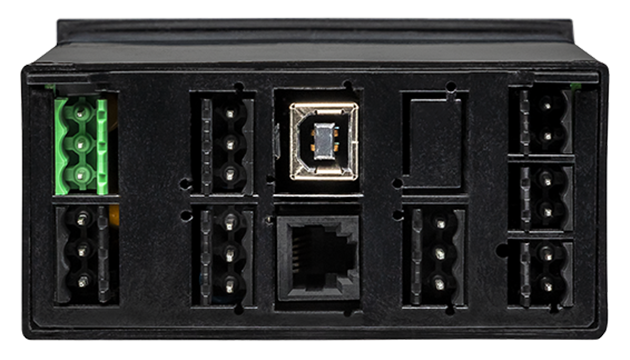
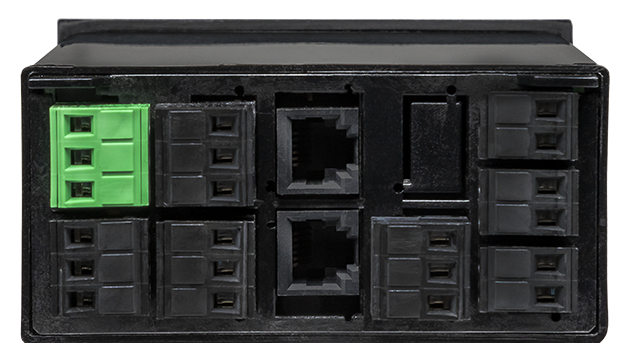
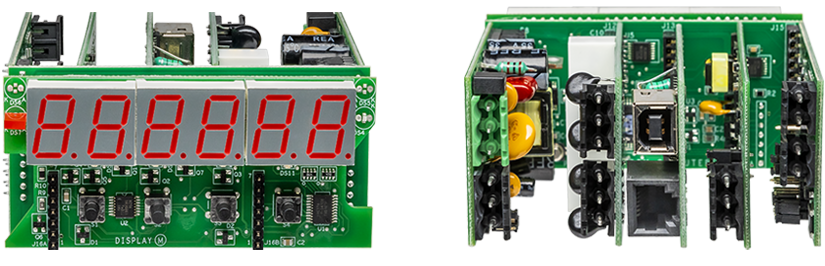
All boards are isolated from meter and power grounds. Optional Plug-in-Play boards for communications and control include Ethernet, WiFi, serial communication boards, dual or quad relay boards, and an analog output board. Laureates may be powered from 85-264 Vac or optionally from 12-32 Vac or 10-48 Vdc. The display is available with bright red or green 0.56" (14.2mm) high LED digits. The 1/8 DIN case meets NEMA 4X (IP65) specifications from the front when panel mounted. Any setup functions and front panel keys can be locked out for simplified usage and security. A built-in 5, 10, 12, or 24 Vdc excitation supply can power transducers, eliminating the need for an external power supply. All power and signal connections are via UL / VDE / CSA rated screw clamp plugs.
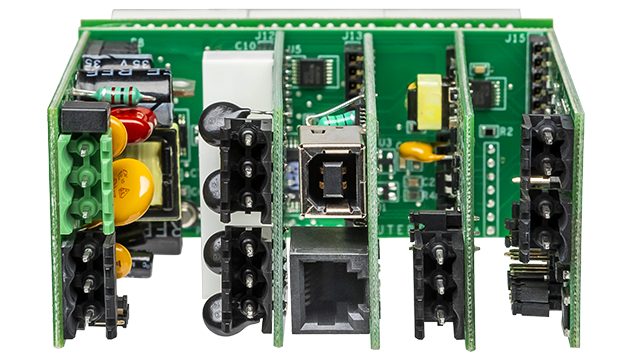
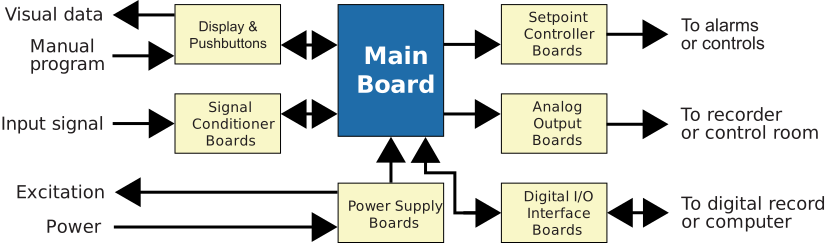
The Laureate™ Series features modular design with up to 7 isolated plug-in boards, applicable to all Laureate 1/8 DIN Digital Panel Meter.
Modular Hardware
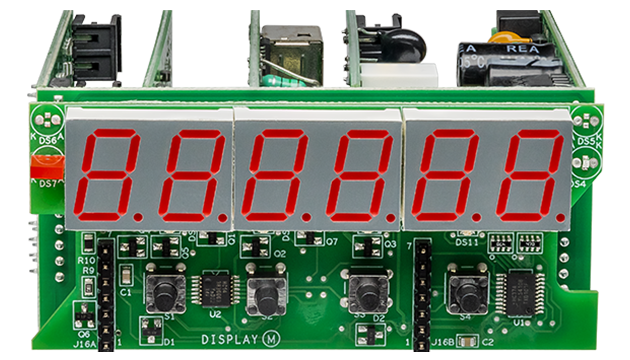
The design of the Laureate™ Series is modular for maximum flexibility at minimum cost. All boards are isolated from meter and power grounds. The base configuration for a digital panel meter or counter consists of a main module (with computer and plug-in display boards), a power supply board, and a signal conditioner board. Optional plug-in-play boards include an isolated setpoint controller board, an isolated analog output board, and an isolated digital interface board. Modular design and a choice of plug-in options allow the Laureate to be customized for a broad range of applications from simple monitoring to control and computer interface. There can be up to five plug-in boards in a 1/8 DIN Laureate.
Connecting Laureate Digital Panel Meter to a Local Area Network (LAN)
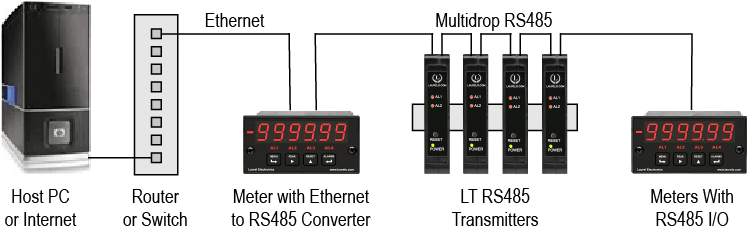
Up to 30 Laureate Digital Panel Meter and/or LT Transmitters can be configured for RS485 and daisy-chained to an LT Transmitter using Laurel’s High Speed Ethernet-to-RS485 converter board for seamless LAN integration. Alternatively, Laurel LTE series Ethernet transmitters can connect directly to a LAN via an Ethernet cable. Setup for both configurations is streamlined using Laurel’s free Instrument Setup Software, which simplifies node discovery and transmitter configuration.
Flexible Communication Options for Digital Panel Meter
The Laureate Digital Panel Meter can be equipped with Laurel communication boards to support various interfaces and protocols. These include serial interfaces with ASCII or Modbus RTU protocols, and Ethernet interfaces with web access, ASCII, or Modbus TCP/IP protocols, ensuring versatile connectivity for your commercial applications.
Understanding the Laureate™ Digital Panel Meter for 6-Digit Analog Input Totalizer & Process
The Laureate™ 1/8 DIN Digital Panel Meter is a six-digit display of rate or total at the push of a front panel key. A Laureate with the Standard counter main board and a VF voltage-to-frequency signal conditioner board can be scaled to display rate or totalized rate to six digits for 0-1 mA, 4-20 mA, or 0-10V analog process signals converted to a frequency of 10 kHz to 110 kHz. The display can be scaled to show flow rate in gallons/minute or liters/sec, volume in gallons or liters, or power consumption in kilowatts and total utilized energy in kilowatt-hours based on the transducer's output.
Square Root Extraction and Accuracy
Square root extraction is selectable and can be applied to rate or total, making the VF Laureate ideal for differential pressure flow meters with a squared output — totalized volume is based on the already-linearized rate. Accuracy is ±0.005% of span ±1 count, among the highest of any panel meter.
Signal Input Characteristics
Input resistance differs by signal type: 50Ω at 4-20 mA, 1.00 kΩ at 0-1 mA, and 1.01 MΩ at 0-10V. Span tempco is ±0.003% of reading/°C, and zero tempco is ±0.003% of full scale/°C.
Principles of V-to-F Operation
The V-to-F signal conditioner converts the full-scale analog signal to a frequency of 10 kHz to 110 kHz, determined by measuring period over a selectable gate time (10 ms to 200 s) and taking the inverse. Selecting a short gate time provides much higher update rates than conventional counting-type frequency meters — at the lowest 10 kHz frequency and minimum 10 ms gate time, the meter achieves 25 updates per second. Update rate is gate time plus 30 ms maximum. Totals are calculated as the product of rate and time in seconds, regardless of the selected gate time, and are stored in non-volatile memory in case of power loss.
Extended DPM Capabilities
- Batch Control Based on Linearized Total — totalizes linearized flow from an analog rate signal, counting up to a preset or down to zero for batch control; requires the dual-relay board, with one relay dedicated to ON/OFF batch control and the other available for rate/total alarm or slow-down near setpoint.
- Custom Curve Linearization — up to 180 data points linearize analog inputs, such as reading tank volume from an irregularly shaped vessel based on level or pressure; linearized readings can also be totalized.
- Time Based on Rate — displays a time inversely proportional to measured rate, such as conveyor time through an oven; as conveyor speed increases, displayed baking time decreases, based on time = distance/speed.
High Resolution Display
Rate or total may be scaled to ±999,999. The two least-significant digits may be set to display zero with rounding, or remain active digits. Noise in rate readings can be reduced with a longer gate time, and an adaptive digital filter reduces noise-driven variation while responding rapidly to genuine signal changes.
Factory-Calibrated Accuracy
All signal conditioner board ranges are factory-calibrated, with calibration factors stored in EEPROM that can be scaled via software to accommodate external shunts, enabling field replacement of the signal conditioner board without recalibrating the meter. Factory recalibration is recommended annually.
Where 6-Digit Analog Totalizer Digital Panel Meters Are Used
- Differential Pressure Flow Metering — direct readout of flow or volume from orifice-plate or venturi DP transducers, with built-in square root extraction.
- Batch Filling & Dosing — up/down batch control driven directly by a 4-20 mA or 0-10V analog flow signal.
- Tank Gauging & Inventory — accurate volume readout from irregularly shaped tanks via level or pressure transmitters and custom curve linearization.
- Oven, Dryer & Conveyor Process Timing — process time computed directly from a rate signal.
- Energy & Utility Metering — power and cumulative energy totalization from watt transducer outputs.
- Retrofit Flow Totalization — adding accurate rate/total display to existing analog-output flow transmitters.
- Water & Wastewater Treatment — flow and volume totalization from DP, ultrasonic, or other analog-output flow instrumentation.
6-Digit Analog Totalizer Digital Panel Meter Frequently Asked Questions
Why does totalizing accuracy not depend on which gate time is selected for the rate measurement?
Totals are documented as calculated as the product of rate and time in seconds regardless of the selected gate time — meaning the totalizing math itself compensates for the gate time chosen, so an operator can select a gate time optimized for display responsiveness or noise reduction without worrying that it will bias the accumulated total.
Why does input resistance vary so dramatically between the three signal types (50Ω, 1kΩ, 1.01MΩ)?
Each signal type has a fundamentally different electrical nature: 4-20 mA is a current signal, so a low input resistance (50Ω) is appropriate to develop a small, manageable voltage drop; 0-1 mA is also current-based but at a lower current level, needing higher resistance (1kΩ) to develop a comparable voltage; 0-10V is already a voltage signal, so a very high input resistance (1.01MΩ) specifically avoids loading down the source.
Can square root extraction be applied to the total as well as the rate, or only the rate?
Documented capability specifically states square root extraction can be applied to either rate or total — and total is specifically documented as being based on the already-linearized rate, meaning the square root correction happens before totalizing, so the accumulated total reflects genuinely linearized flow rather than a squared, uncorrected signal.
How does the "time based on rate" function actually compute process time from a speed signal?
It applies the mathematical relationship time = distance/speed — with a fixed, pre-configured distance (such as the length of an oven) and a live rate signal (such as conveyor speed from a tachometer), the meter continuously calculates and displays the resulting time, which decreases as the input rate signal increases and increases as it decreases.
Does the batch control mode require both relays on the dual-relay board, or can it work with a single relay?
Documented setup specifically requires the dual-relay output board for batch control, with one relay dedicated specifically to ON/OFF batch control — the second relay is available but not strictly required for basic batch control itself, since it's documented as being available for an additional function like slowing rate near setpoint or providing a separate alarm.
If I set the two least-significant digits to round to zero, does that affect the accuracy of the totalized value stored internally, or just what's displayed?
This is documented specifically as a display option — rounding the least-significant digits affects what's shown for readability, and doesn't inherently change the meter's underlying accuracy or the value used internally for totalizing and analog output; it's a presentation choice rather than a measurement precision tradeoff.
Can the meter's totalizer continue accumulating correctly through a brief power interruption?
Yes — totals are documented as being stored in non-volatile memory specifically in case of power loss, meaning a brief interruption doesn't reset or lose the accumulated total; counting resumes from the last stored value once power is restored.
Does custom curve linearization for an irregular tank need to account for the specific pressure or level transmitter's own nonlinearity, or just the tank's shape?
The 180-point linearization is applied to the overall relationship between the transmitter's signal and the actual desired reading (such as volume), which inherently captures both the tank's shape and any nonlinearity contributed by the transmitter itself — since the calibration points are based on real measured data pairs, whatever combination of tank geometry and transmitter behavior produces the actual signal-to-volume relationship gets captured together.
Why does the page list two different accuracy figures — ±0.005% of span in the description and ±0.01% of full scale in the specification table?
Both figures are documented on the page, and while they aren't identical, they describe closely related but not necessarily interchangeable accuracy metrics (span versus full scale, and slightly different percentage figures) — confirming which specific figure applies to a given signal conditioner range and configuration against current factory documentation is worth doing when the distinction matters for a precision-critical application.
Is the 25 updates/second maximum rate achievable at any input frequency, or only at the lowest end of the V-to-F range?
Documented specifically as achievable at the lowest frequency (10 kHz) combined with the minimum 10 ms gate time — since higher V-to-F output frequencies inherently provide more signal periods within the same gate time, the update rate relationship across the full 10 kHz to 110 kHz range isn't necessarily uniform, and the specific 25 updates/second figure is documented for that particular combination of conditions.
Does selecting a longer gate time for a smoother rate reading also introduce lag into the analog output retransmission of that rate?
Yes, in a documented, expected way — since the analog output tracks the meter's displayed rate, and a longer gate time inherently means each rate value reflects a longer averaging window, the analog output naturally carries the same responsiveness tradeoff as the front-panel display; an application needing the fastest possible analog output response should use a shorter gate time, accepting more reading-to-reading variation in exchange for that faster response.
DP Flow Meter Turndown Ratio & Square Root Extraction Questions From the Field
Why does a differential pressure flow meter's accuracy get dramatically worse at low flow rates, even with a perfectly calibrated transmitter?
Documented physics specifically explains this: flow rate through a DP element is proportional to the square root of differential pressure, so any measurement error in the pressure signal itself gets magnified by the square root relationship — this is a fundamental nonlinearity of the flow element, not a transmitter resolution problem, meaning even a perfectly calibrated transmitter can't overcome the underlying physics at low flow.
What is "turndown ratio" and why is it specifically limiting for DP flow meters compared to other flow technologies?
Documented definition specifically describes turndown ratio as the ratio of maximum to minimum flow an instrument can measure while maintaining reasonable accuracy — DP meters like orifice plates are documented as having a notably poor native turndown ratio (commonly cited as 3:1 to 5:1) compared to technologies like magnetic or ultrasonic flow meters (20:1 to 40:1 or higher), specifically because of the square-root nonlinearity inherent to differential pressure measurement.
Does a differential pressure transmitter's own turndown capability (sometimes rated up to 100:1) mean the overall flow measurement achieves that same turndown?
No — documented analysis specifically distinguishes these: a DP transmitter's pressure-sensing turndown can genuinely reach up to 100:1, but the square root extraction step specifically limits the overall flow measurement's practical turndown to a much lower figure (often cited around 3:1), since the transmitter's own high-end capability doesn't overcome the fundamental accuracy degradation the square root relationship introduces at low flow.
Is there a documented rule of thumb for the flow turndown ratio engineers commonly use when deciding whether a DP orifice meter is appropriate?
Yes — documented industry practice specifically cites 3:1 as a commonly used rule-of-thumb turndown ratio limit for orifice-plate DP flow meters; if an application's required turndown exceeds this commonly documented limit, the documented recommendation is to consider a different flow measurement technology entirely rather than pushing a DP meter beyond its practical accuracy range.
Can multiple DP transmitters be used together to extend a flow meter's effective low-end turndown range?
Yes — documented practice specifically describes "transmitter stacking" or parallel/split-range configurations on large venturi or orifice installations, using multiple transmitters with different ranges together specifically to extend accurate measurement further into the low-flow region than a single transmitter alone could achieve, though this documented approach adds installation complexity and cost.
Why do some documented sources specifically recommend using a "reasonable" flow range that's noticeably narrower than a DP transmitter's full rated pressure range?
Documented worked examples specifically show that achieving a "reasonable" 10:1 flow turndown requires roughly a 100:1 differential pressure transmitter turndown, due to the square-root relationship — this mismatch means DP flowmeter technology was historically considered genuinely accurate only across roughly the top third of its nominal pressure range (documented as approximately 30-100% of full-scale flow units), not its entire rated span.
Does noise in the raw differential pressure signal have a bigger practical effect at low flow than at high flow, even if the sensor's absolute noise level stays constant?
Yes — documented analysis specifically explains that a constant absolute noise level on the DP signal represents a much larger relative error at low flow, since the underlying DP signal itself is small at low flow (proportional to flow squared) — the square-root calculation used to derive flow then amplifies this proportionally larger relative error, which is documented as producing erratic, oscillating, or unstable readings specifically at the low end of a DP meter's range.
For applications genuinely needing high turndown, is switching flow meter technology entirely the only documented solution, or are there other options?
Documented guidance specifically presents multiple paths: switching to an inherently higher-turndown technology (magnetic, ultrasonic, or Coriolis meters) is one documented option, but multivariable DP transmitters that integrate pressure, static pressure, and temperature compensation into a more sophisticated flow calculation are also documented as achieving meaningfully improved turndown (up to 100:1 in some cited cases) while still using the fundamental DP measurement principle.
