New Front Panel USB-C Port Coming Soon!
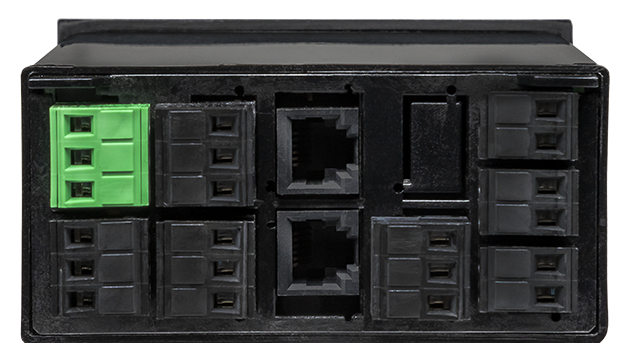
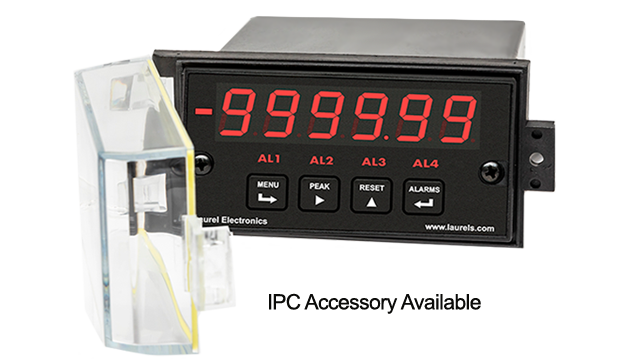
Pulse Width Modulation (PWM) is a transducer output format where the measured information is provided as duty cycle applied to a constant frequency, such as 120 Hz. As for duty cycle, the panel meter divides the average pulse width by the period between pulses over a gate time which is selectable from 10 ms to 199.99 s. It then scales this ratio mathematically to display this ratio in engineering units, such as relative humidity (RH).
The Laureate duty cycle and pulse width modulation meter uses an Extended counter main board and the FR dual-channel signal conditioner board, which accepts signals from 12 mV to 250 Vac, inputs from proximity switches with a PNP or NPN output, TTL or CMOS logic, and contact closures. Jumper selections provide optimum operation for different sensor types and noise conditions. A built-in (isolated) 5, 10, 12, or 24 Vdc excitation supply can power proximity switches and other sensors.
The Laureate Panel Meter is easily programmed with Laurel’s free Instrument Setup Software, downloadable from our website and compatible with Windows PCs, requiring a data interface board for setup.
All signal conditioner board ranges are factory-calibrated, with calibration factors for each range securely stored in an onboard EEPROM. These factors can be scaled via software to accommodate external shunts, enabling field replacement of signal conditioner boards without necessitating recalibration of the associated panel meter. For optimal accuracy, factory recalibration is recommended annually. All Laurel Electronics instruments undergo factory calibration using the industry-leading Fluke calibrators, which are recalibrated yearly and certified traceable to national standards, ensuring the highest level of precision and reliability.
Peak and valley values are automatically captured. These may be displayed via a front panel pushbutton command or control signal at the rear connector, or be transmitted as serial data.
Two rear panel control Inputs (CMOS/TTL levels, logic 0 = tied to digital ground, logic 1 = open) or dry contacts that can be set to control / activate 14 meter commands.
An (isolated) 5, 10, 12, or 24 Vdc excitation output is standard to power transducers or two-wire transmitters. Ratiometric operation, which automatically compensates for changes in the applied excitation, is jumper selectable for applications, such as bridges, where the signal to be measured is proportional to the excitation level.
| Duty Cycle Measurement | |
|---|---|
| Item Displayed | ON or OFF duty cycle of periodic pulse waveshape |
| Display Units | 1%, 0.1%, 0.01% |
| Frequency Range | 0.005 Hz to 10 kHz |
| Accuracy | 0.01%, 0.005 Hz to 500 Hz, 0.1% at 5 kHz, 1% at 10 kHz |
| Maximum Timing Interval | 199.99 s |
| Pulse Width Modulation (PWM) Measurement | |
| Item Displayed | Measurement based on Pulse Width Modulation (PWM) input |
| Display Units | Scaled reading in engineering units |
| Frequency Range | 0.005 Hz to 10 kHz |
| Accuracy | 0.01%, 0.005 Hz to 500 Hz, 0.1% at 5 kHz, 1% at 10 kHz |
| Maximum Timing Interval | 199.99 s |
| Display | |
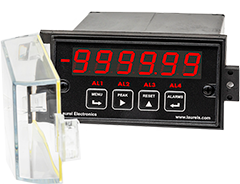
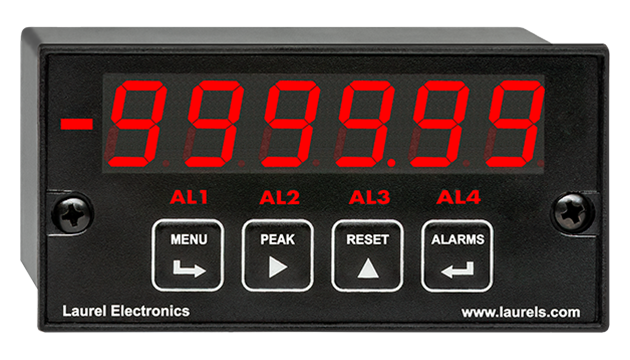
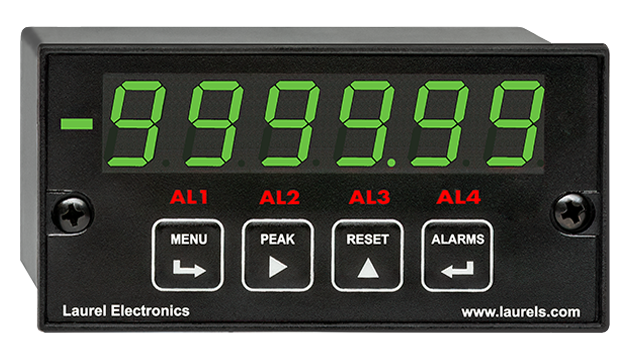
| Readout | 6 LED digits, 7-segment, 14.2 mm (.56"), red or green. |
| Range | -999,999 to +999,999 |
| Indicators | Four LED lamps |
| Inputs | |
| Types | AC, pulses from NPN, PNP transistors, contact closures, magnetic pickups. |
| Signal Ground | Common ground for channels A & B |
| Minimum Signal | Nine ranges from (-12 to +12 mV) to (+1.25 to +2.1V). |
| Maximum Signal | 250 Vac |
| Noise Filter | 1 MHz, 30 kHz, 250 Hz (selectable) |
| Contact Debounce | 0, 3, 50 ms (selectable) |
| Recalibration: All ranges are calibrated at the factory. Recalibration is recommended every 12 months. | |
| Update Rate | |
| Conversion Interval | Gate time + 30 ms+ 0-2 signal periods |
| Gate Time | Selectable 10 ms to 199.99 s |
| Time Before Zero Out | Selectable 10 ms to 199.99 s |
| Excitation Output (standard) | |
| 5 Vdc | 5 Vdc ± 5%, 100 mA (jumper selectable) |
| 10 Vdc | 10 Vdc ± 5%, 120 mA (jumper selectable) |
| 12 Vdc | 12 Vdc ± 5%, 100 mA (jumper selectable) |
| 24 Vdc | 24 Vdc ± 5%, 50 mA (jumper selectable) |
| Output Isolation | 50 Vdc from signal ground |
| Power Supply Boards (one required) | |
| Voltage, standard | 85-264 Vac or 90-300 Vdc |
| Voltage, optional | 12-32 Vac or 10-48 Vdc |
| Frequency | DC or 47-63 Hz |
| Power consumption (typical, base meter) | 1.2W @ 120 Vac, 1.5W @ 240 Vac, 1.3W @ 10 Vdc, 1.4W @ 20 Vdc, 1.55W @ 30 Vdc, 1.8W @ 40 Vdc, 2.15W @ 48 Vdc |
| Power Isolation | 250V rms working, 2.3 kV rms per 1 min test |
| Analog Output Boards (one optional) | |
| Output levels | 4-20 mA, 0-20 mA, 0-10V, -10 to +10V (jumper selectable) |
| Current compliance | 2 mA at 10V ( > 5 kΩ load) |
| Voltage compliance | 12V at 20 mA (< 600 Ω load) |
| Scaling | Zero and full scale adjustable from -99999 to +99999 |
| Resolution | 16 bits (0.0015% of full scale) |
| Isolation | 250V rms working, 2.3 kV rms per 1 min test |
| (dual analog outputs share the same ground) | |
| Relay Output Boards (one optional) | |
| Dual magnetic relays | 2 Form C, 10A max, 440Vac or 125Vdc max, 2500VA or 300W |
| Quad magnetic relays | 4 Form A (NO), 10A max, 440Vac or 125Vdc max, 2500VA or 300W |
| Dual solid state relays | 2 Form A (NO), AC or DC, 0V - 400V, 120Ma, 35Ohms (max at On-State) |
| Quad solid state relays | 4 Form A (NO), AC or DC, 0V - 400V, 120Ma, 35Ohms (max at On-State) |
| Relay commons | Isolated commons for dual relays or each pair of quad relays |
| Relay isolation | 250V rms working, 2.3 kV rms per 1 minute test |
| Relay latching modes | Latching or non-latching |
| Relay active modes | Active on or off, active high or low |
| Hysteresis modes | QA passband mode, split hysteresis, span hysteresis |
| Communication Boards (one optional) | |
| Board selections | RS232, RS485 with dual RJ11 connectors, RS485 with dual RJ45 connectors, USB, Ethernet, USB-to-RS485 gateway, Ethernet-to-RS485 gateway, WiFi with built-in antenna plus USB & RS485, WiFi with external antenna plus USB & RS485 |
| Protocols | Laurel Custom ASCII (serial), Modbus RTU (serial), Modbus TCP (Ethernet or WiFi) |
| Digital addresses | 247 (Modbus), 31 (Laurel ASCII), |
| Isolation | 250V rms working, 2.3 kV rms per 1 min test |
| Environmental | |
| Operating temperature | -40°C to 70°C (-40°F to 158°F) |
| Storage temperature. | -40°C to 85°C (-40°F to 185°F) |
| Relative humidity | 95% at 40°C, non-condensing |
| Protection | NEMA-4X (IP-65) when panel mounted |
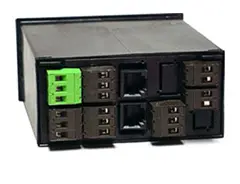
| Signal Connections | |
 |
|
| Mechanical | |
| Enclosure | 1/8 DIN, high impact plastic, UL 94V-0, color: black |
| Mounting | 1/8 DIN panel cutout required: 3.622" x 1.772" (92 mm x 45 mm). |
| Dimensions | 4.68" x 2.45" x 5.64" (119 mm x 62 mm x 143 mm) (W x H x D) |
| Maximum panel thickness | 4.5 mm (0.18") |
| Tightening Torque - Connectors | Screw terminal connectors: 5 lb-in (0.56 Nm) |
| Tightening Torque - Pawls | Digital Panel Meter Case Pawls: 5 lb-in (0.56 Nm) |
| Weight of base meter | 210 g (7.4 oz) typical (DPM, counter, timer, 6-digit remote display) |
| Weight of option boards | 30 g (1.0 oz) typical per board (analog output, relay output, communications) |
| General | |
| Programming Methods | Four front panel buttons or via Laurel's free Instrument Setup Software, which runs on a PC under MS Windows. |
| Security | Lockout options include using the front panel buttons, the free Instrument Setup Software, or a hardware jumper. |
| Warranty | 3 years parts & labor |
| Recalibration: All ranges are calibrated at the factory. Recalibration is recommended every 12 months. | |
|
|
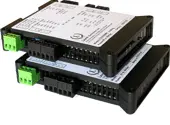
| 1/8 DIN Digital Panel Meters | DIN Rail Transmitters |
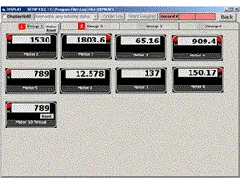
Free Downloadable Windows-based Instrument Setup (IS) software (Data Interface Board Required) for use with our programmable Digital Panel Meters, Scale Meters, Counters, Timers, Remote Displays, and Transmitters, are an easy method to set up Laureate 1/8 DIN digital panel meters, counters, timers, remote displays, and DIN-rail transmitters, as explained in the Instrument Setup Software Manual. Laureate 1/8 DIN instruments can also be set up from the front panel, as explained in their respective Owners Manuals. Instrument Setup software is of benefit whether or not the PC is connected to the instrument.
Set User Account Control (UAC) of MS Windows to "Never notifiy me" so that Instrument Setup Software can create directories. The UAC change screen can be reached as follows:
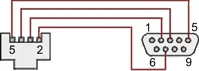
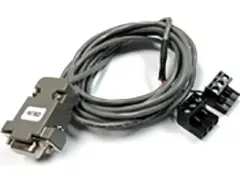
RJ11-to-DB9 cable with rear view of DB9 connector to PC
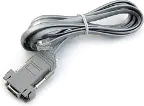
RS232 cable, meter to PC, P/N CBL01
Laureate 1/8 DIN Laureate instruments must be equipped with a serial communications board and be connected to the computer via a serial communications cable. The connection can be via RS232, RS485, USB or Ethernet. Following setup, the serial communications board may be removed from the instrument if desired. The wiring of the RS232 cable is illustrated above with end views of the two connectors.
Laureate LT Series transmitters come standard with a 3-wire serial interface, which can be jumpered for RS232 or RS485.
Laureate LTE Series transmitters come standard with an Ethernet interface.
Click on any of the reduced screens below for a full-size screen view, then click on the Back button of your browser to return to this page. The screens examples below are for a fully-loaded Series 2 Digital Panel Meter (DPM), which is connected to the PC via RS232. If the meter is a Series 1 meter (pre-2007), this is sensed by the software, and somewhat different screens are brought up. Please see Series 1 setup screens.


From the Main Menu, click on Readings if your PC is connected to the meter. A pull-down menu then offers three choices: List, Plot and Graph.


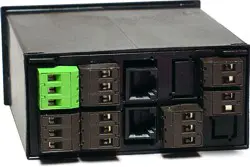


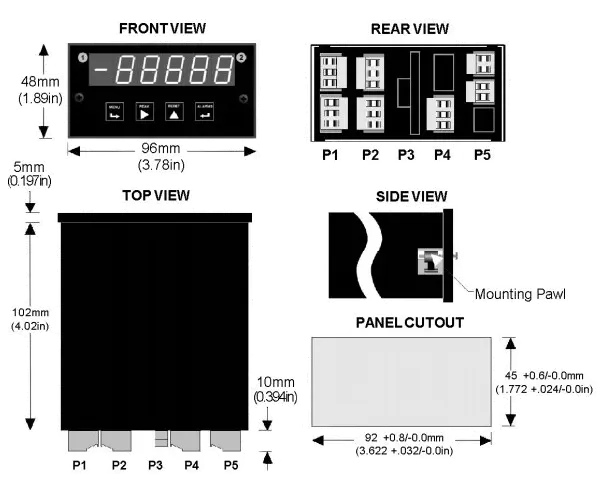
Maximum panel thickness: 4.5 mm (0.18")
Weight of base meter: 210 g (7.4 oz) typical (DPM, counter, timer, 6-digit remote display)
Weight of option boards: 30 g (1.0 oz) typical per board (analog output, relay output, communications)
Tightening Torque - Connectors: Screw terminal connectors: 5 lb-in (0.56 Nm)
Tightening Torque - Pawls: Digital Panel Meter Case Pawls: 5 lb-in (0.56 Nm)
Dimensioned CAD assembly drawings in EPRT, STEP, x_t. dwg, pdf file formats: Laureate-meter-case.zip (zipping prevents browser from opening CAD files as text files).
 Slide the meter into a 45 x 92 mm 1/8 DIN panel cutout. Ensure that the provided gasket is in place between the front of the panel and the back of the meter bezel.
The meter is secured by two pawls, each held by a screw, as illustrated. Turning each screw counterclockwise extends the pawl outward from the case and behind the panel. Turning each screw clockwise further tightens it against the panel to secure the meter.
Slide the meter into a 45 x 92 mm 1/8 DIN panel cutout. Ensure that the provided gasket is in place between the front of the panel and the back of the meter bezel.
The meter is secured by two pawls, each held by a screw, as illustrated. Turning each screw counterclockwise extends the pawl outward from the case and behind the panel. Turning each screw clockwise further tightens it against the panel to secure the meter.
Turning each screw counterclockwise loosens the pawl and retracts it into its well. This position allows installed meter to be removed from their panel, or new meters to be installed in a panel. Do not remove the screws from their pawls. Doing so would cause the screw and pawl to fall off and likely get lost. Do not overtighten so as not to damage the plastic parts.
| Duty Cycle & Pulse Width Modulation (PWM) Modes | |
|---|---|
 |
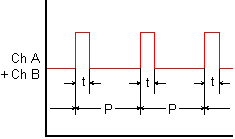
In duty cycle mode, the meter displays ON or OFF time in percent from 0% to 100% of period for repetitive pulse trains. In the illustration, duty cycle in percent is 100 x t/P. In pulse width modulation (PWM) mode, the meter also determines the duty cycle ratio, but then scales this ratio for display in engineering units. |
| Monitoring Laser OperationPM and Speed | |
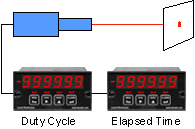 |
Laureate counters can be programmed to display the duty cycle of a laser, the number of pulses, elapsed time, the number of pulses, the average pulse width in µs, and total energy applied. This data can be transmitted digitally via RS485 or Ethernet. |
CAL-Digital
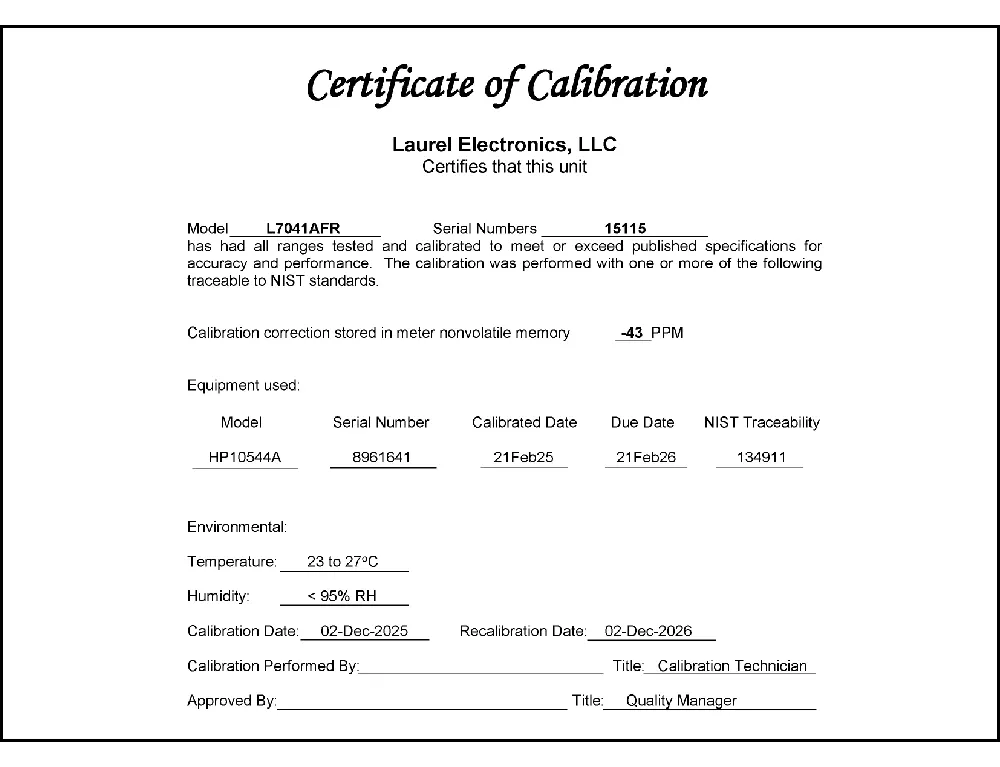
Certificate of Calibration
$65.00DLS-XLOG2
XLog2 Data logging Software
$495.00IPC
Digital Panel Meter Splashproof Cover
$55.00CASE1
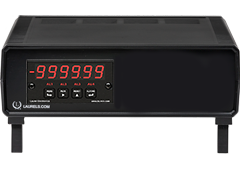
Digital Panel Meter Benchtop Case1
$150.00CASE2
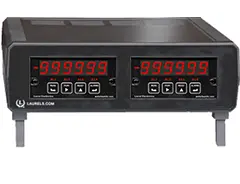
Digital Panel Meter Benchtop Case2
$150.00BOX1
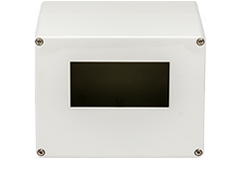
DPM Enclosure Nema-4x Box1
$180.00BOX2
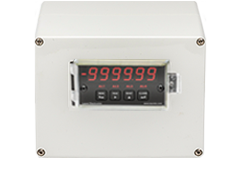
DPM Enclosure Nema-4x BOX2
$230.00CON01
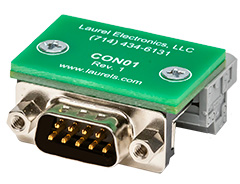
CON01 Connector
$75.00CBL6
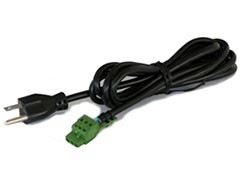
6-foot Power Cable
$41.00CBL12
12-foot Power Cable
$47.00CBL01
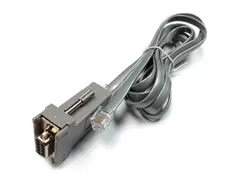
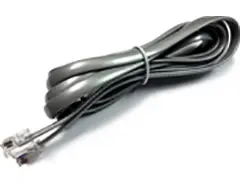
RS232 Cable for Meters
$35.00CBL02
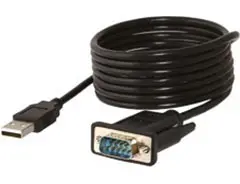
USB-to-RS232 Adapter Cable
$47.00CBL04
RS232 Cable for LT Transmitters
$47.00CBL05
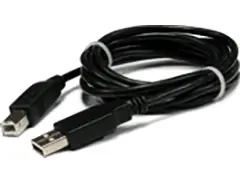
USB Data Cable for Meters
$47.00CBL06
USB-to-RS485 Adapter Cable
$47.00CBL07
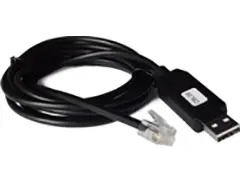
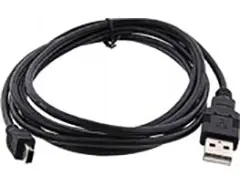
USB Programming & Data Cable
$47.00CBL08
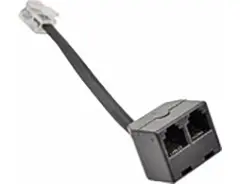
RS485 Splitter Cable
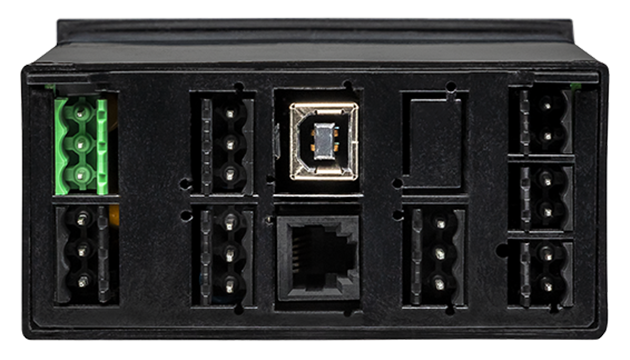
$33.00All boards are isolated from meter and power grounds. Optional Plug-in-Play boards for communications and control include Ethernet, WiFi, serial communication boards, dual or quad relay boards, and an analog output board. Laureates may be powered from 85-264 Vac or optionally from 12-32 Vac or 10-48 Vdc. The display is available with bright red or green 0.56" (14.2mm) high LED digits. The 1/8 DIN case meets NEMA 4X (IP65) specifications from the front when panel mounted. Any setup functions and front panel keys can be locked out for simplified usage and security. A built-in 5, 10, 12, or 24 Vdc excitation supply can power transducers, eliminating the need for an external power supply. All power and signal connections are via UL / VDE / CSA rated screw clamp plugs.
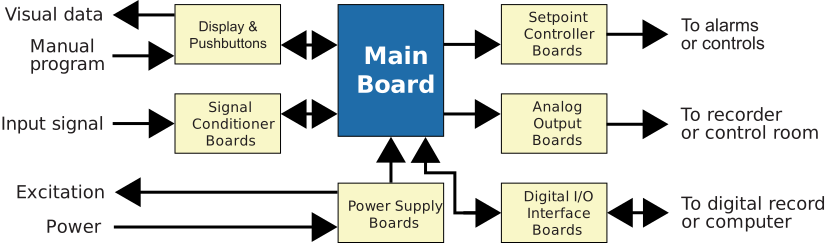
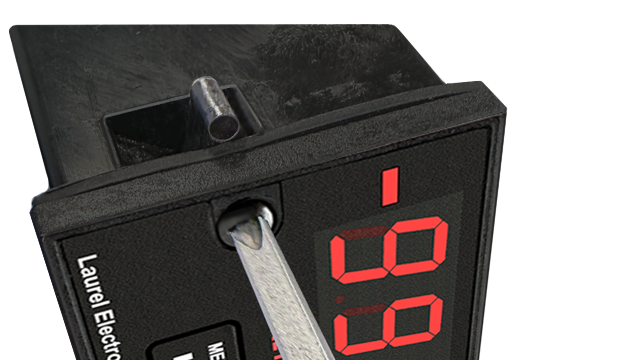
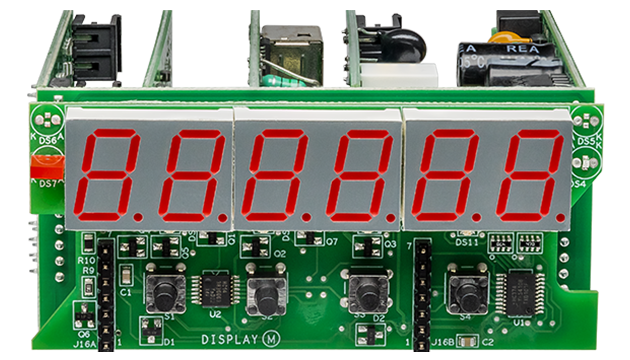
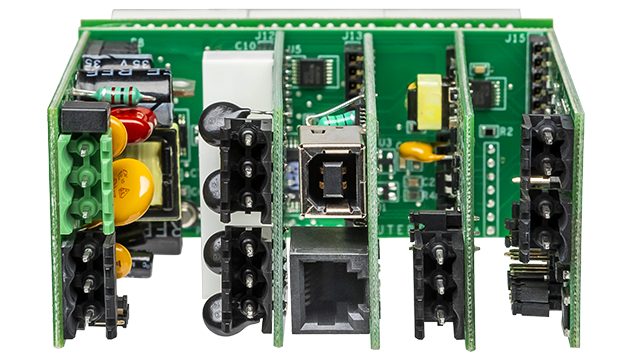
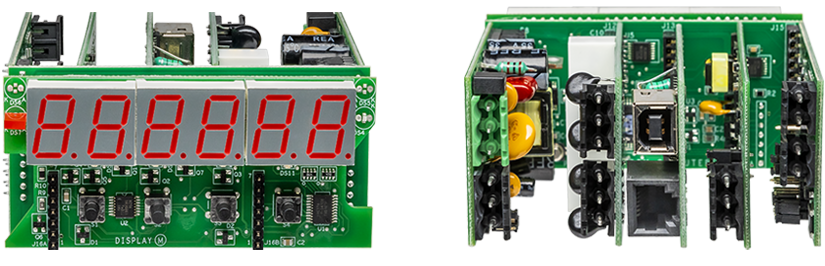
The design of the Laureate™ Series is modular for maximum flexibility at minimum cost. All boards are isolated from meter and power grounds. The base configuration for a panel meter or counter consists of a main module (with computer and plug-in display boards), a power supply board, and a signal conditioner board. Optional plug-in-play boards include an isolated setpoint controller board, an isolated analog output board, and an isolated digital interface board. Modular design and a choice of plug-in options allow the Laureate to be customized for a broad range of applications from simple monitoring to control and computer interface. There can be up to five plug-in boards in a 1/8 DIN Laureate.
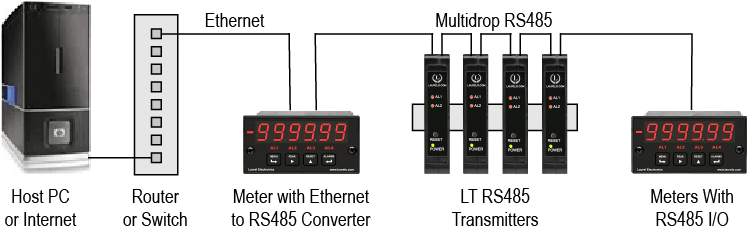
Up to 30 Laureate Panel Meter and/or LT Transmitters can be configured for RS485 and daisy-chained to an LT Transmitter using Laurel’s High Speed Ethernet-to-RS485 converter board for seamless LAN integration. Alternatively, Laurel LTE series Ethernet transmitters can connect directly to a LAN via an Ethernet cable. Setup for both configurations is streamlined using Laurel’s free Instrument Setup Software, which simplifies node discovery and transmitter configuration.
The Laureate Panel Meter can be equipped with Laurel communication boards to support various interfaces and protocols. These include serial interfaces with ASCII or Modbus RTU protocols, and Ethernet interfaces with web access, ASCII, or Modbus TCP/IP protocols, ensuring versatile connectivity for your commercial applications.
The Laureate™ 1/8 DIN Panel Meter for duty cycle measures ON or OFF period as a percentage of total period. Duty cycle is determined by averaging an integral number of periods over a gate time selectable from 10 ms to 199.99 s. The same signal is applied to Channels A and B. The meter divides the average pulse width t by the period P between pulses and expresses the ratio t/P in percent, with resolution of 1%, 0.1%, or 0.01% selectable. By selecting leading or falling pulse edges, ON or OFF duty cycle can be displayed.
PWM is a transducer output format where measured information is provided as duty cycle applied to a constant frequency, such as 120 Hz. As with duty cycle mode, the meter divides the average pulse width by the period between pulses over the selectable gate time, then scales this ratio mathematically to display it in engineering units — such as relative humidity (RH). This is the meter's primary use case: reading transducers that specifically encode a measurement as duty cycle at a fixed carrier frequency, rather than general-purpose motor or LED PWM signals.
Frequency range for both duty cycle and PWM modes is 0.005 Hz to 10 kHz. Accuracy is 0.01% from 0.005 Hz to 500 Hz, degrading to 0.1% at 5 kHz and 1% at 10 kHz. Maximum timing interval is 199.99 s.
The meter uses an Extended counter main board and the FR dual-channel signal conditioner, accepting signals from 12 mV to 250 Vac — including NPN/PNP proximity switch outputs, TTL/CMOS logic, and contact closures, with jumper selections optimizing operation for different sensor types and noise conditions. Because this configuration uses the Extended counter, the meter is also capable of A-B time interval, stopwatch, frequency, rate, period, square root of rate, up or down total, arithmetic functions, simultaneous rate and total, phase angle, batching, and custom curve linearization.
All signal conditioner board ranges are factory-calibrated, with calibration factors stored in EEPROM that can be scaled via software to accommodate external shunts, enabling field replacement of the signal conditioner board without recalibrating the meter. Factory recalibration is recommended annually.
The underlying calculation is identical — dividing average pulse width by period over the gate time — but duty cycle mode displays that ratio directly as a percentage, while PWM mode takes the same ratio and mathematically scales it into the transducer's actual engineering units (such as relative humidity), because many PWM-output sensors are specifically designed so their duty cycle percentage maps to a real-world measurement range rather than being the value of interest itself.
Duty cycle and pulse width both require timing within the same repeating pulse train — one edge starts the width measurement and the opposite edge stops it, then the meter also needs to measure the full period between pulses to compute the ratio. Feeding the same signal to both channels lets the meter extract both the pulse width and the period from a single input source.
This reflects the underlying counting-based measurement technique — at higher input frequencies, fewer clock counts are available within each period to resolve pulse width and period precisely, which is why accuracy is inherently better at lower frequencies within the meter's rated 0.005 Hz to 10 kHz range.
120 Hz is specifically cited as a typical constant carrier frequency for PWM-output transducers, though the meter's rated range of 0.005 Hz to 10 kHz accommodates a much broader range of possible sensor carrier frequencies beyond that specific example.
With 0.01% resolution available as a selectable option, the meter can resolve very fine duty cycle changes, which matters because a PWM sensor's engineering-unit resolution (such as %RH resolution) is directly tied to how finely the meter can resolve the underlying duty cycle ratio — coarser duty cycle resolution directly limits the finest resolvable change in the scaled engineering-unit reading.
Yes — the same 10 ms to 199.99 s gate time range and the same fundamental averaging-over-multiple-periods principle applies, trading response speed for measurement stability. A longer gate time averages more periods of the input signal for a steadier duty cycle reading, at the cost of a slower update rate.
The documented laser monitoring application covers duty cycle, pulse count, elapsed time, average pulse width, and total energy applied together — so total energy tracking is included alongside the purely timing-based measurements, using the Extended counter's additional arithmetic and totalizing capability layered on top of the basic duty cycle timing function.
This configuration specifically uses the Extended counter main board — which is also what enables the meter's broader additional capabilities (time interval, stopwatch, rate, phase angle, batching, and more) beyond basic duty cycle measurement.
Yes — the relay output boards support standard high/low alarm configuration plus QA passband, split hysteresis, and span hysteresis modes, any of which can be applied to the duty cycle or PWM-scaled reading to flag or control based on a measured value moving outside an acceptable range.
Yes, via the optional communications board — RS232, RS485 (Modbus RTU or Laurel ASCII), or Ethernet (Modbus TCP) options are available to transmit readings to external systems, in addition to or instead of local display and relay-based alarming.
This is documented in real sensor datasheets — a genuine humidity/temperature sensor IC's PWM output varies duty cycle linearly with the measured value between defined endpoints, and a related real-world design approach maps a transducer's ratiometric output so that a 10% duty cycle represents one end of the measurement span (the offset) and roughly 80-90% duty cycle represents the other end (full span), giving a clean linear relationship a receiving meter can scale directly into engineering units.
Yes, and this is specifically documented as one of PWM encoding's core advantages for sensor transmission — like a current-loop signal, a PWM output is documented as having good noise immunity and being well suited to transmission over longer distances, since duty cycle information survives cable-induced signal degradation better than a raw analog voltage level would.
Real documented troubleshooting of this exact issue points to the PWM output frequency accuracy spec of the generating device itself — a real device datasheet documents a fan PWM output frequency accuracy spec of roughly ±7%, and a device commanded to 50% duty cycle was documented actually producing 46-49%, which was within that device's own rated tolerance rather than indicating a fault. Checking the generating device's own frequency/duty-cycle accuracy specification against the observed variation is the documented first step before assuming a receiving meter is misreading.
Yes — documented PWM sensor interface design shows that in a typical application, the raw PWM output is filtered (commonly via an RC network) to reconstruct a smooth analog voltage that varies linearly with the sensor's measurement, meaning the filter's characteristics directly affect how faithfully the reconstructed value tracks the true duty cycle. A meter that measures the PWM duty cycle directly (via timing, as this Laureate configuration does) rather than through an RC-filtered analog reconstruction avoids this particular source of error.
Yes — one documented humidity sensor circuit design specifically sets duty cycle via the ratio of two resistors (rather than digital calibration), which keeps the resulting frequency independent of supply voltage but is documented as achieving an accuracy of only about ±3.9% RH — notably coarser than a digitally-calibrated PWM sensor IC, illustrating that the sensor's own encoding method, not just the receiving meter, sets a real limit on overall system accuracy.
This is a specifically documented design choice, not an oversight — limiting duty cycle to a range like 10% (offset) to 80-90% (full span) rather than the full 0-100% avoids the ambiguity that occurs near the true 0% and 100% extremes, where a receiving instrument may have difficulty reliably distinguishing "a very short pulse" from "no pulse at all," or "always on" from "a signal fault." Leaving margin at both extremes keeps the encoding unambiguous across the sensor's full rated measurement range.
For a typical fixed-carrier-frequency PWM sensor, only duty cycle carries the measurement information, with the carrier frequency held constant by design — however, this isn't universal across all PWM-style sensing schemes; some documented sensor designs specifically vary the frequency of an applied signal (separate from duty cycle) to probe frequency-dependent sensor characteristics, so confirming which specific encoding scheme a given transducer actually uses is worth verifying rather than assuming duty cycle is always the only carrier of information.