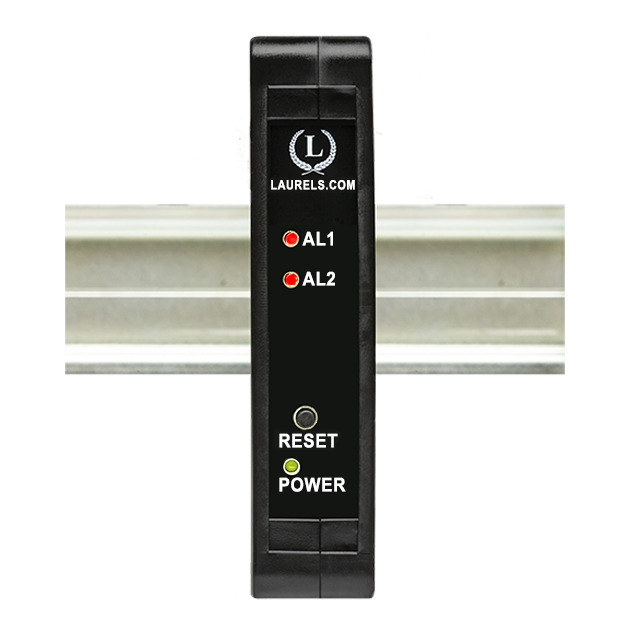
New Front Panel USB-C Port Coming Soon!
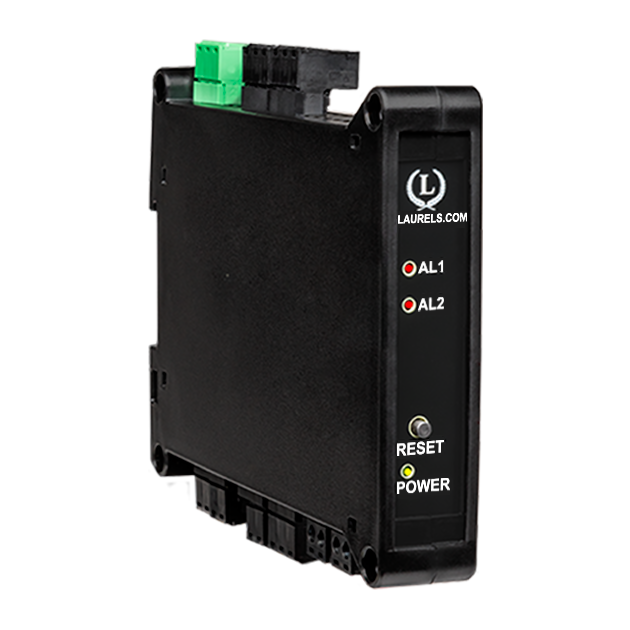
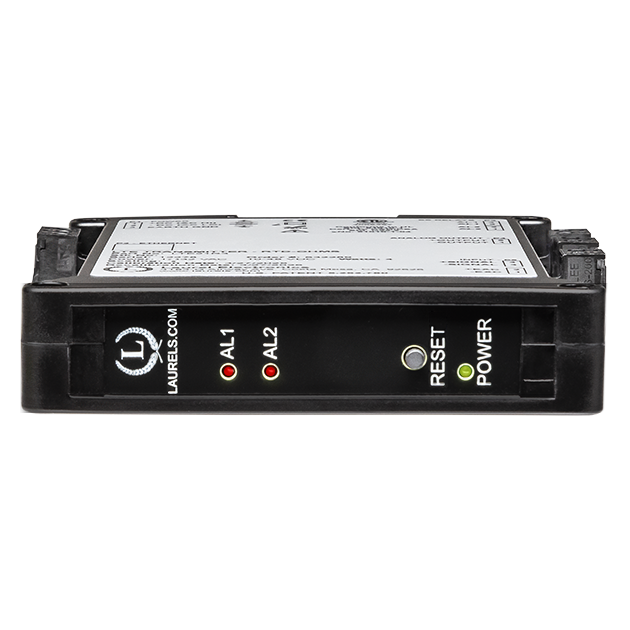
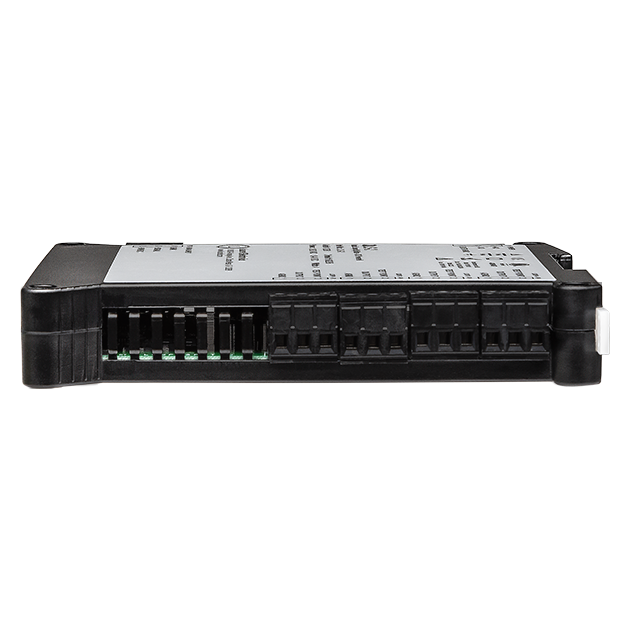
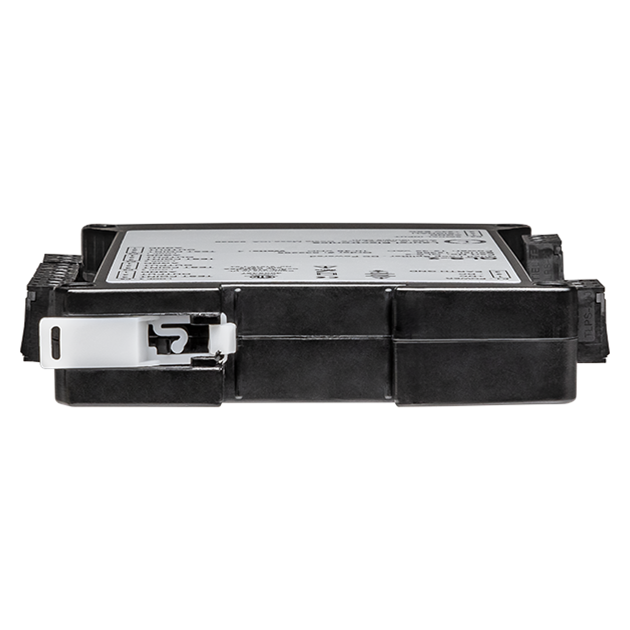
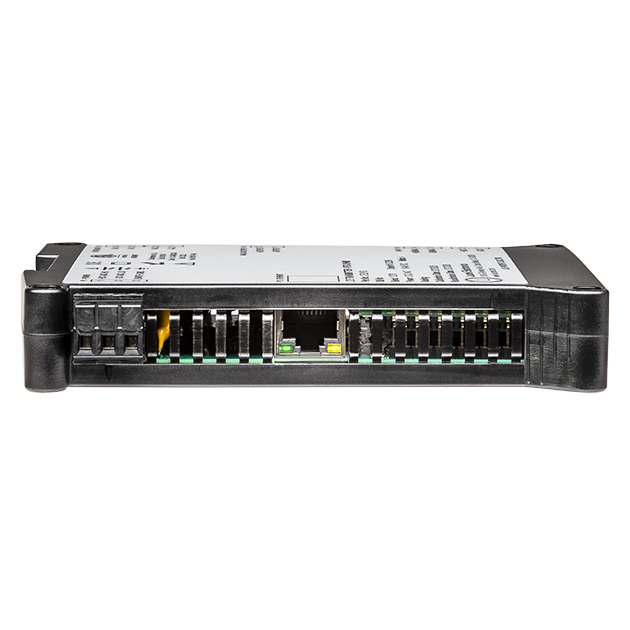
The Laureate 4-20 mA, 0-20 mA, 0-10V or -10V to +10V and ethernet output transmitter for process signal input provides zero and span adjustment for use with a wide range of industrial transducers. Six DC voltage and four DC current input ranges are jumper selectable. The two most sensitive voltage ranges, 200.00 mV and 2.0000V, provide a high input impedance of 1 GΩ to minimize the load on the voltage signal.
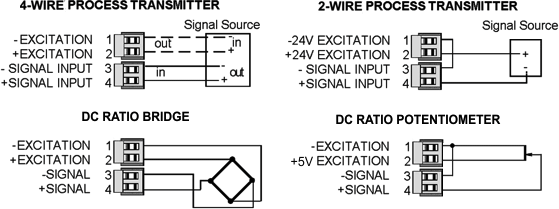
The transmitter can be set to a ratio (or potentiometer follower) mode by making selections at the connector and in software. In this mode, the transmitter output tracks a ratio of the applied excitation voltage and is unaffected by changes in the excitation voltage. Ratiometric measurements provide an exceptional accuracy of 0.01% of reading ± 2 counts. This capability is used with the transmitter's 5V or 10V excitation output for load cells and Wheatstone bridges, and with the transmitter's 5V excitation output for potentiometers which track wiper position.
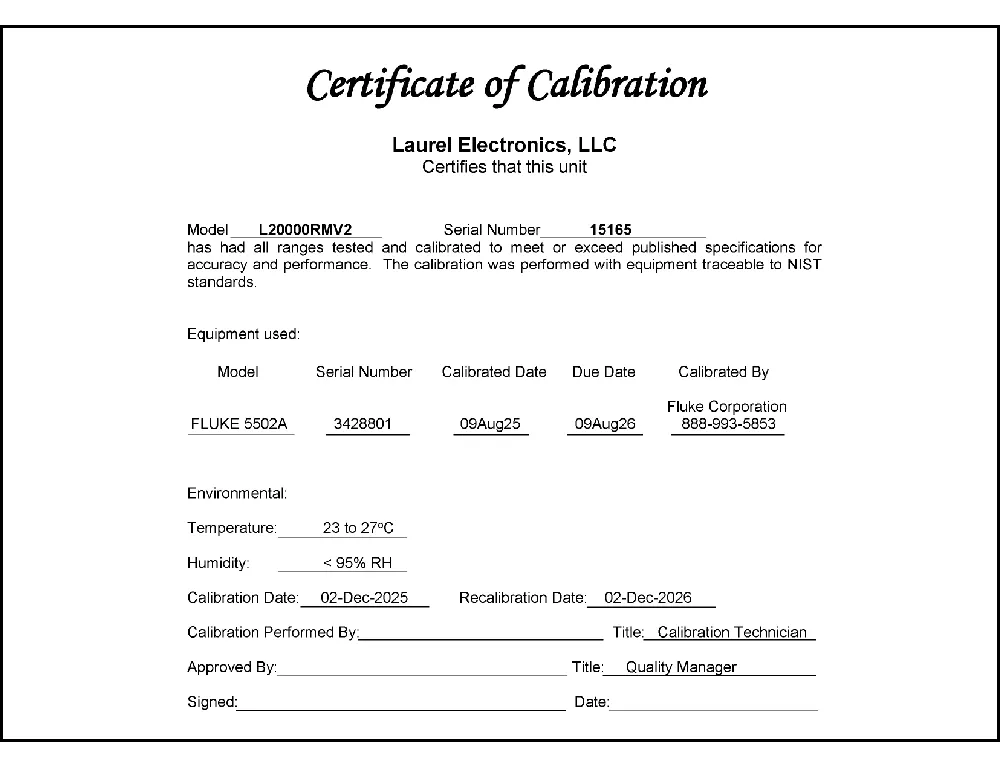
All signal conditioner board ranges are factory-calibrated, with calibration factors for each range securely stored in an onboard EEPROM. These factors can be scaled via software to accommodate external shunts, enabling field replacement of signal conditioner boards without necessitating recalibration of the associated transmitter. For optimal accuracy, factory recalibration is recommended annually. All Laurel Electronics instruments undergo factory calibration using the industry-leading Fluke calibrators, which are recalibrated yearly and certified traceable to national standards, ensuring the highest level of precision and reliability.
The optional extended Laureate computer board enhances Laureate Transmitters by displaying rates derived from successive readings and enabling highly accurate custom curve linearization. For example, it can calculate liquid volume or flow rate in a horizontal cylindrical tank using levels from a 4-20 mA transmitter. Setup is straightforward: users input up to 180 data points into a spreadsheet or text file, and the computer calculates spline-fit segments, which are then downloaded to the transmitter for precise operation.
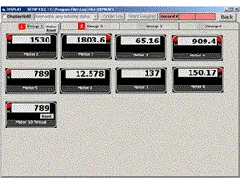
Easy USB-C Programming: Configure Laureate transmitters through the front-panel USB-C port with Laurel’s free Instrument Setup Software for Windows. Configurations can be saved to the transmitter, a PC, a file server, or a USB thumb drive. Laurel’s free Instrument Setup Software can also be used for light-duty data collection.
High read rate of up to 50 or 60 conversions per second, the Laureate™ LTE Series transmitter uses Concurrent Slope (US Pat. 5,262,780) analog-to-digital conversion to integrate signals over a full power line cycle (50 Hz or 60 Hz). This read rate enables peak and valley capture, real-time computer interfacing, and control applications. Peak and valley values are automatically captured and can be viewed using Laurel’s free Instrument Setup Software (compatible with Windows PCs) or transmitted as serial data.
Two tare functions: auto-tare and manual tare. In auto-tare, an input line is grounded by an external pushbutton. This causes the current weight, which is normally the empty weight of the container to be stored in memory as an offset. In manual tare, the tare value can be entered manually via a control input pushbutton or using Laurel's free Instrument Setup Software.
Peak and valley values are automatically captured. These may be displayed via Laurel's free Instrument Setup Software, which runs on a PC under MS Windows or can be transmitted as serial data.
An (isolated) 5, 10, 12, or 24 Vdc excitation output is standard to power transducers or two-wire transmitters. Ratiometric operation, which automatically compensates for changes in the applied excitation, is jumper selectable for applications, such as bridges, where the signal to be measured is proportional to the excitation level.
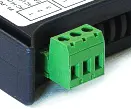
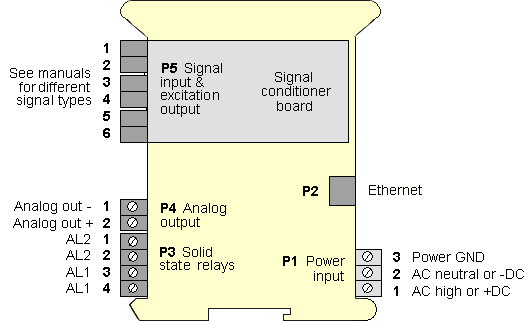
LTE series DIN rail transmitters & signal conditioners can be interfaced to a wide range of sensors and transducers using one of seven available plug-in signal conditioner boards. The transmitters duplicate the high performance (high accuracy, high read rate) and extensive programmable features of Laureate 1/8 DIN digital panel meters, counters and timers. They utilize the same signal conditioners boards, much of the same firmware, and Laurel's free Windows-based Instrument Setup Software. They come in a compact DIN rail mount package with detachable screw-clamp connectors for easy wiring.
The LTE series Transmitters accessible from this page include a 4-20 mA, 0-20 mA, 0-10V, or -10V to +10V analog output (isolated, user selectable), an ethernet serial data interface (isolated, user selectable), and dual 120 mA solid state AC/DC relays (isolated). An (isolated) 5, 10, 12, or 24 Vdc transducer excitation output is included with all models other than those with a temperature or AC RMS signal conditioner.
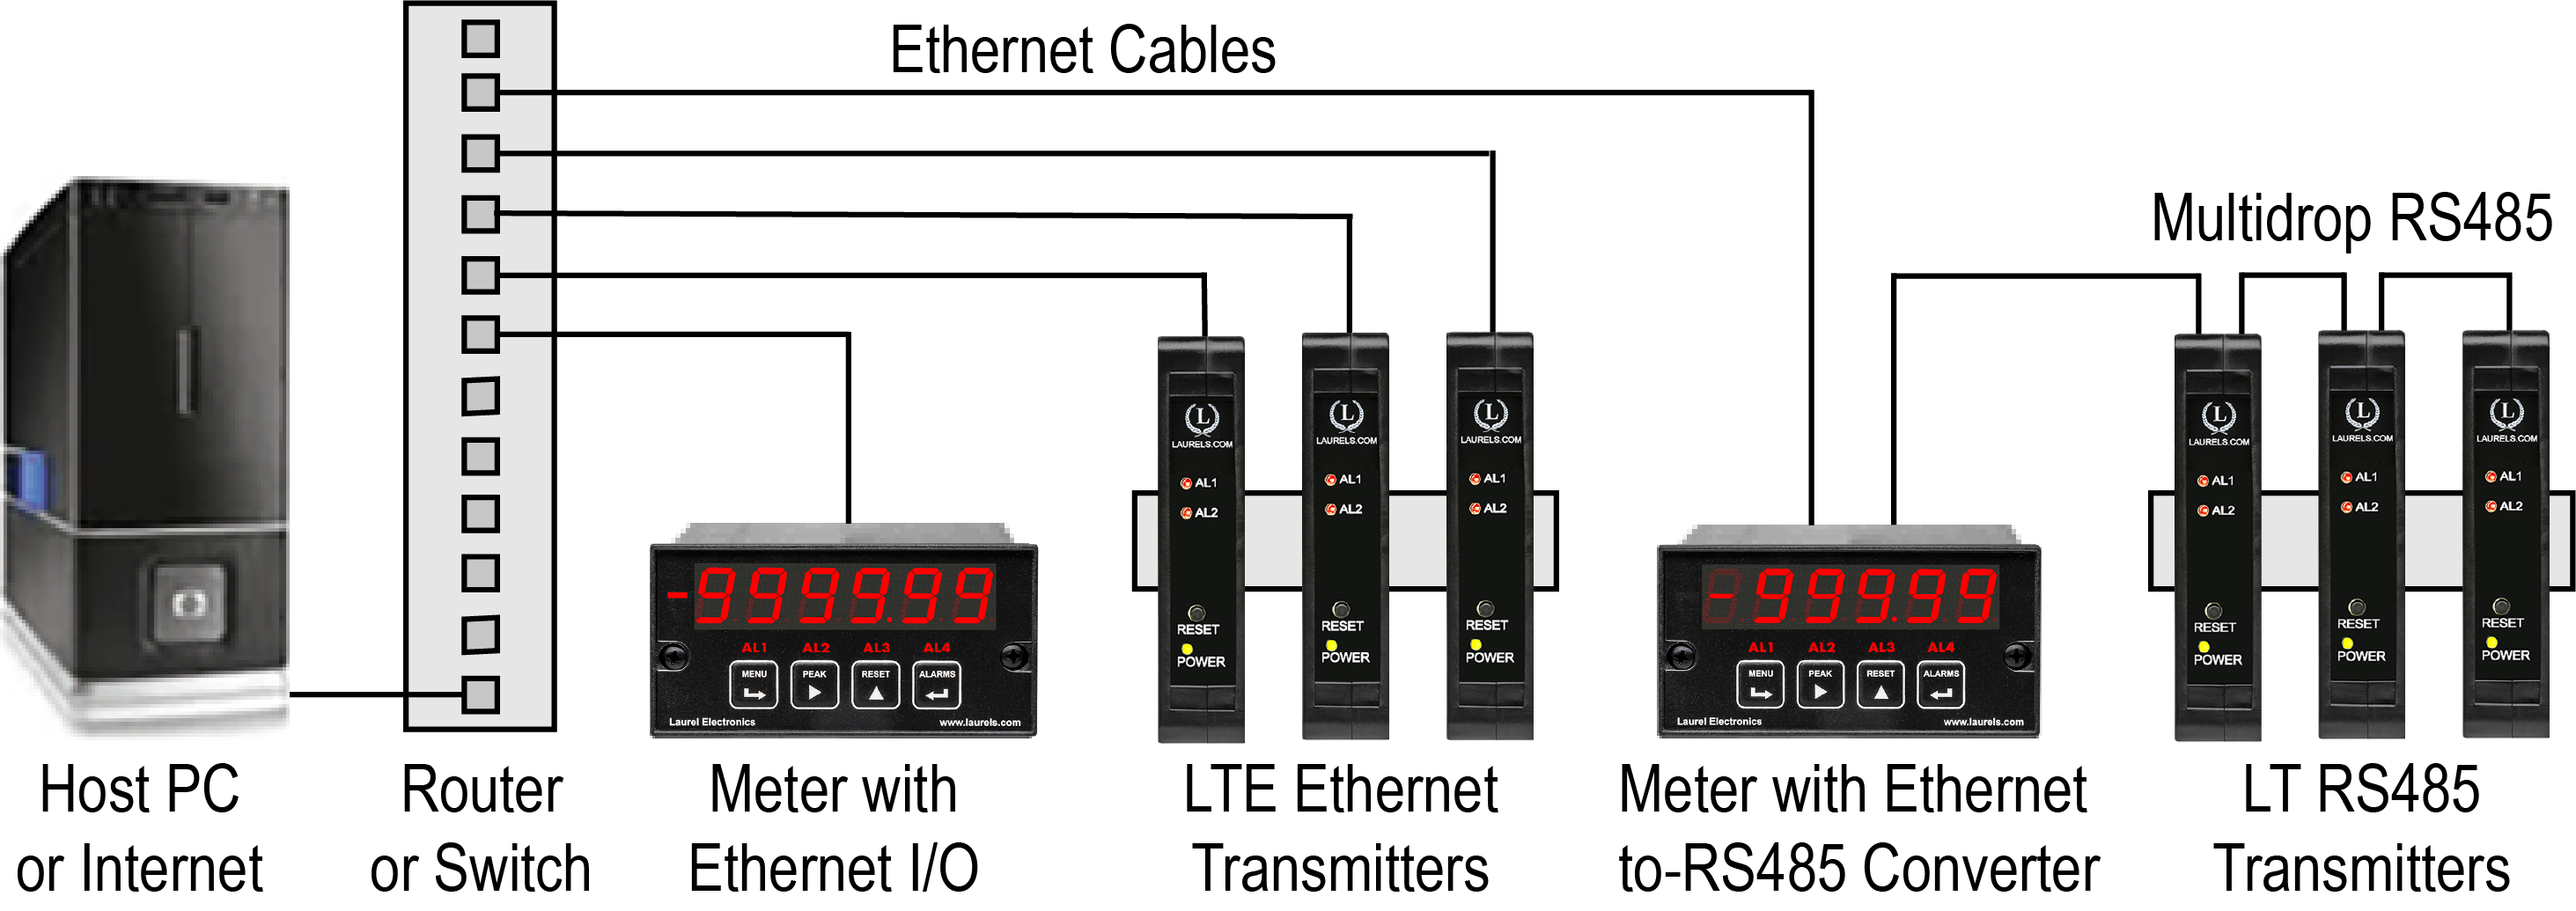
Laurel LTE series Ethernet transmitters can connect directly to a LAN via an Ethernet cable. Up to 30 Laureate LT Transmitters and/or Digital Panel Meters can be configured for RS485 and daisy-chained to an LT Transmitter for seamless LAN integration. Setup for both configurations is streamlined using Laurel’s free Instrument Setup Software, which simplifies node discovery and transmitter configuration.
Laureate Transmitters can be equipped with Laurel communication boards to support various interfaces and protocols. These include serial interfaces with ASCII or Modbus RTU protocols, and Ethernet interfaces with web access, ASCII, or Modbus TCP/IP protocols, ensuring versatile connectivity for your commercial applications.
| LTE Transmitter Signal Input & Function | Model Series | Analog Output | Ethernet I/O | Dual Relays | |
|---|---|---|---|---|---|
| 1 | DC Input Voltage and Current | LTE-DC |  |
|
|
| 2 | AC RMS Voltage or Current | LTE-RMS | |
|
|
| 3 | Process Voltage or Current | LTE-P | |
|
|
| 4 | Strain Gauge or Potentiometer Follower | LTE-SG | |
|
|
| 5 | Weighing Applications | LTE-WA | |
|
|
| 6 | Load Cell & Microvolt Signals | LTE-WM | |
|
|
| 7 | Thermocouple (Types J, K, T, E, N, R, S) | LTE-TC | |
|
|
| 8 | RTD Temperature | LTE-RTD | |
|
|
| 9 | Resistance in Ohms | LTE-R | |
|
|
| 10 | Frequency, Rate, Speed | LTE-FR | |
|
|
| 11 | Pulse Input Totalizer | LTE-FR | |
|
|
| 12 | Process Signal Totalizer | LTE-VF | |
|
|
| 13 | Batch Controller Analog Input | LTE-FR | |
|
|
| 14 | Batch Controller Pulse Input | LTE-FR | |
|
|
| 15 | Sum, Difference, Ratio, Product of 2 Inputs | LTE-FR | |
|
|
| 16 | On/Off Duty Cycle | LTE-FR | |
|
|
| 17 | Stopwatch Timing for Single Events | LTE-FR | |
|
|
| 18 | Average Time of Periodic Events | LTE-FR | |
|
|
| 19 | AC Phase Angle and Power Factor | LTE-FR | |
|
|
| 20 | Quadrature Position or Rate | LTE-QD | |
|
|
| Analog Input | Range | Resolution | Reading Accuracy | Input Ohms |
|---|---|---|---|---|
| DC Voltage | ±200.00 mV | 10 µV | 0.01% FS ± 2 cts | 1 GΩ |
| ±2.0000 V | 100 µV | 0.01% FS ± 2 cts | 1 GΩ | |
| ±20.000 V | 1 mV | 0.01% FS ± 2 cts | 10 MΩ | |
| ±200.00 V | 10 mV | 0.01% FS ± 2 cts | 10 MΩ | |
| ±600.0 V* | 100 mV | ± 0.4 V | 10 MΩ | |
| DC Current | ±2.0000 mA | 0.1 µA | 0.01% FS ± 2 cts | 100 Ω |
| ±20.000 mA | 1 µA | 0.01% FS ± 2 cts | 10 Ω | |
| ±200.00 mA | 10 µA | 0.01% FS ± 2 cts | 1 Ω | |
| ±5.000 A | 1 mA | ±10 mA | 0.01 Ω | |
| * Range not ETL certified. | ||||
| Reading Resolution | 16 bits (65,536 steps) | |||
| Reading Accuracy | 0.01% of full scale ± 2 counts (except 5A range) for absolute measurements. 0.01% of reading ± 2 counts for ratiometric measurements. |
|||
| Update Rate, Max | 50/sec at 50 Hz, 60/sec at 60 Hz | |||
| Max applied voltage | 600 Vac for 20, 200 & 600 V ranges, 125 Vac other ranges | |||
| Over-current protection | 25x for 2 mA, 8x for 20 mA, 2.5x for 200 mA, 1x for 5 A | |||
| Recalibration: All ranges are calibrated at the factory. Recalibration is recommended every 12 months. | ||||
| Analog Output (standard) | ||||
| Output Levels | 0-20 mA or 0-10 Vdc (selectable) | |||
| Compliance, 4-20 mA | 10V (0-500Ω load) | |||
| Compliance, 0-10V | 2 mA (5 kΩ load) | |||
| Output Resolution | 16 bits (65,536 steps) | |||
| Output Accuracy | 0.02% of output span plus conversion accuracy | |||
| Output Isolation | 250V rms working, 2.3 kV rms per 1 minute test | |||
| Ethernet Data I/O (standard) | ||||
| Type | 10/100 Base-T Ethernet per IEEE 802.3 | |||
| Data Rates | 300, 600, 1200, 2400, 4800, 9600, 19200 baud | |||
| Output Isolation | 250V rms working, 2.3 kV rms per 1 min test | |||
| Serial Protocol | Modbus TCP | |||
| Modbus Compliance | Modbus over Serial Line Specification V1.0 (2002) | |||
| Digital Addresses | 247 | |||
| Dual Relay Output (standard) | ||||
| Relay Type | Two solid state relays, SPST, normally open, Form A | |||
| Load Rating | 120 mA at 140 Vac or 180 Vdc | |||
| Excitation Output (standard) | ||||
| 5 Vdc | 5 Vdc ± 5%, 100 mA (jumper selectable) | |||
| 10 Vdc | 10 Vdc ± 5%, 120 mA (jumper selectable) | |||
| 12 Vdc | 12 Vdc ± 5%, 100 mA (jumper selectable) | |||
| 24 Vdc | 24 Vdc ± 5%, 50 mA (jumper selectable) | |||
| Output Isolation | 50 Vdc from signal ground | |||
| Ratiometric operation | 5 Vdc or 10 Vdc for bridge circuits, 5 Vdc for potentiometers | |||
| Power Input | ||||
| Standard Power | 85-264 Vac or 90-300 Vdc | |||
| Low Power Option | 10-48 Vdc or 12-32 Vac | |||
| Power Frequency | DC or 47-63 Hz | |||
| Power Isolation | 250V rms working, 2.3 kV rms per 1 min test | |||
| Power Consumption | 2.5W typical at 34V, 4.0W with max excitation output | |||
| Mechanical | ||||
| Dimensions | 129 x 104 x 22.5 mm case | |||
| Mounting | 35 mm rail per DIN EN 50022 | |||
| Connectors | Detachable screw-clamp connectors for signal and power RJ45 jack for Ethernet | |||
| Signal Connections | ||||
 |
Environmental | |||
| Operating Temperature | -40°C to 70°C (-40°F to 158°F) | |||
| Storage Temperature | -40°C to 85°C (-40°F to 185°F) | |||
| Relative Humidity | 95% at 40°C, non-condensing | |||
| Cooling Required | Mount transmitters with ventilation holes at top and bottom. Leave 6 mm (1/4") between transmitters, or force air with a fan. | |||
| Mechanical | ||||
| Enclosure | Rugged black polycarbonate housing material | |||
| Mounting | 35 mm rail per DIN EN 50022 | |||
| Dimensions | 129 x 104 x 22.5 mm case | |||
| Connectors | Detachable screw clamp connectors meet VDE / IEC / UL / CSA standards. RJ45 jack for Ethernet | |||
| Tightening Torque | Screw terminal connectors: 5 lb-in (0.56 Nm) | |||
| Weight | Complete transmitter: 183 g (6.5 oz) | |||
| Replacement Case Screws | ||||
| Size | 6 | |||
| Thread Pitch | 6-19 | |||
| Length | 1/2" | |||
| Head Style | Pan Head | |||
| Drive Style | Phillips | |||
| Head Diameter | 0.256-0.270 | |||
| Head Height | 0.087-0.097 | |||
| Full/Partial Thread | Full | |||
| Drive Size | 2 | |||
| Material | Steel | |||
| Finished | Black Oxide | |||
| General | ||||
| Front-Panel Port | USB-C (programming & data) | |||
| Programming | Utilize Laurel's free Instrument Setup Software, which runs on a PC under MS Windows | |||
| Security | Lockout options available using Laurel's free Instrument Setup Software | |||
| Warranty | 3 years parts & labor | |||
| Recalibration: All ranges are calibrated at the factory. Recalibration is recommended every 12 months. | ||||

A Laureate process meter or transmitter with the Extended main board option allows exceptionally accurate custom curve linearization. For setup, up to 180 data points can be entered into a spreadsheet. The system then creates multiple non-linear spline-fit segments, which provide much better accuracy than linear segments. One application, as illustrated, is the readout of volume of irregularly shaped tanks based on measured liquid level or pressure. Altimeters and thermistors are further applications.
|
|
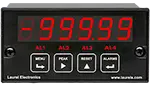
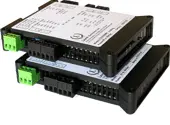
| 1/8 DIN Digital Panel Meters | DIN Rail Transmitters |
Free Downloadable Windows-based Instrument Setup (IS) software (Data Interface Board Required) for use with our programmable Digital Panel Meters, Scale Meters, Counters, Timers, Remote Displays, and Transmitters, are an easy method to set up Laureate 1/8 DIN digital panel meters, counters, timers, remote displays, and DIN-rail transmitters, as explained in the Instrument Setup Software Manual. Laureate 1/8 DIN instruments can also be set up from the front panel, as explained in their respective Owners Manuals. Instrument Setup software is of benefit whether or not the PC is connected to the instrument.
Set User Account Control (UAC) of MS Windows to "Never notifiy me" so that Instrument Setup Software can create directories. The UAC change screen can be reached as follows:
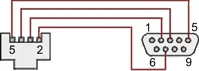
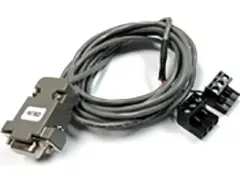
RJ11-to-DB9 cable with rear view of DB9 connector to PC
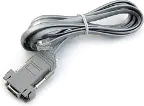
RS232 cable, meter to PC, P/N CBL01
Laureate 1/8 DIN Laureate instruments must be equipped with a serial communications board and be connected to the computer via a serial communications cable. The connection can be via RS232, RS485, USB or Ethernet. Following setup, the serial communications board may be removed from the instrument if desired. The wiring of the RS232 cable is illustrated above with end views of the two connectors.
Laureate LT Series transmitters come standard with a 3-wire serial interface, which can be jumpered for RS232 or RS485.
Laureate LTE Series transmitters come standard with an Ethernet interface.
Click on any of the reduced screens below for a full-size screen view, then click on the Back button of your browser to return to this page. The screens examples below are for a fully-loaded Series 2 Digital Panel Meter (DPM), which is connected to the PC via RS232. If the meter is a Series 1 meter (pre-2007), this is sensed by the software, and somewhat different screens are brought up. Please see Series 1 setup screens.


From the Main Menu, click on Readings if your PC is connected to the meter. A pull-down menu then offers three choices: List, Plot and Graph.


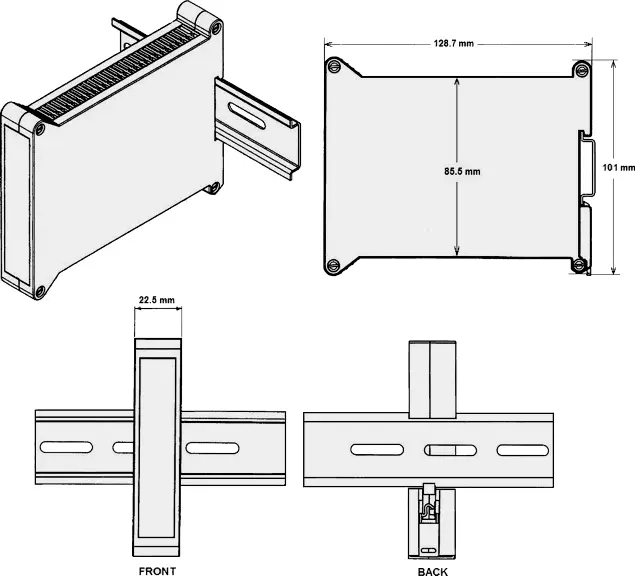
Dimensioned CAD assembly drawings in EPRT, STEP, x_t, .dwg, pdf file formats: Laureate-transmitter-case.zip (zipping prevents browser from opening CAD files as text files).
CAL-Analog
Certificate of Calibration
$65.00DLS-XLOG2
XLog2 Data logging Software
$495.00CON01
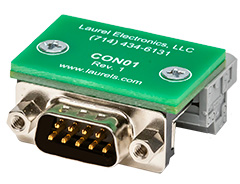
CON01 Connector
$75.00CBL6
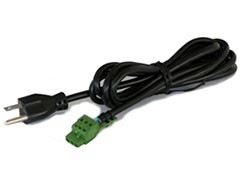
6-foot Power Cable
$41.00CBL12
12-foot Power Cable
$47.00CBL02
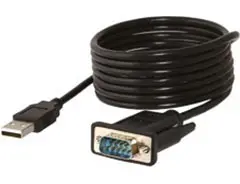
USB-to-RS232 Adapter Cable
$47.00CBL04
RS232 Cable for LT Transmitters
$47.00The Laureate™ LTE Series DIN rail transmitter for process signal input provides zero and span adjustment for use with a wide range of industrial transducers. Six DC voltage and four DC current input ranges are jumper selectable. The two most sensitive voltage ranges, 200.00 mV and 2.0000V, provide a high input impedance of 1 GΩ to minimize the load on the voltage signal.
The transmitter can be set to a ratio (or potentiometer follower) mode by making selections at the connector and in software. In this mode, the transmitter output tracks a ratio of the applied excitation voltage and is unaffected by changes in the excitation voltage. Ratiometric measurements provide an exceptional accuracy of 0.01% of reading ±2 counts, compared to 0.01% of full scale ±2 counts (except the 5A range) for absolute measurements. This capability is used with the transmitter's 5V or 10V excitation output for load cells and Wheatstone bridges, and with the 5V excitation output for potentiometers tracking wiper position.
Input resistance is 1 GΩ on the 200.00 mV and 2.0000V ranges, 10 MΩ on the 20.000V, 200.00V, and 600.0V ranges (the 600.0V range is not ETL certified). Maximum applied voltage is 600 Vac for the 20V/200V/600V ranges, 125 Vac for other ranges. Overcurrent protection is 25x for 2 mA, 8x for 20 mA, 2.5x for 200 mA, and 1x for 5A. Update rate is up to 50/sec at 50 Hz or 60/sec at 60 Hz. The same DC signal conditioner board can be user-configured for DC, process, bridge, and potentiometer signals, precalibrated in EEPROM for all DC volt and DC amp ranges.
A Laureate process transmitter with the Extended main board option allows exceptionally accurate custom curve linearization. Up to 180 data points can be entered into a spreadsheet; the system then creates multiple non-linear spline-fit segments, which provide much better accuracy than linear segments. One application is the readout of volume in irregularly shaped tanks based on measured liquid level or pressure. Altimeters and thermistors are further applications.
Standard Ethernet Data I/O is 10/100 Base-T per IEEE 802.3, isolated to 250V rms working / 2.3 kV rms per 1 minute test. The supported serial protocol is Modbus TCP at digital address 247. Analog output levels are 0-20 mA or 0-10 Vdc (selectable), with 16-bit resolution and 0.02% of output span accuracy plus conversion accuracy.
Documented specification lists these as two separate accuracy formulas tied to how each mode processes the signal — ratiometric mode's documented immunity to excitation voltage changes means its accuracy tracks the actual reading itself, while absolute mode's documented accuracy is instead pegged to the fixed full-scale range regardless of where the actual reading falls; this reflects a genuine difference in what each mode's accuracy figure is mathematically referenced against.
The page documents 5V or 10V excitation as available for bridges and load cells, but specifically lists only 5V for potentiometers, without detailing the underlying reason for this narrower option — this is consistent with the documented excitation options simply differing by application type as specified, so a potentiometer follower application should be configured with the documented 5V excitation rather than assuming the 10V option is also available for that specific use case.
No — documented phrasing specifically describes the single physical signal conditioner board as being configurable across these different signal types, which is consistent with one mode being selected via jumper and software settings at a time, not multiple modes operating concurrently; this reflects hardware flexibility (one board serving several distinct application types) rather than simultaneous multi-mode operation.
Documented footnote specifically marks only the ±600.0V range with this qualifier, distinct from the LTE DC Voltage/Current transmitter's separate footnote phrasing ("certified to ±300.0V") for its own ±600.0V range — this indicates the two pages document this same top voltage range's certification status somewhat differently, so the precise certification scope for the 600V range should be confirmed against whichever specific transmitter model is actually being specified.
No — documented SG1 option describes custom scaling (specifying min/max input and corresponding min/max reading) as a configuration choice for how raw signal maps to a displayed value, not as a change to the underlying signal conditioning accuracy; both SG and SG1 use the same documented DC/process signal conditioner hardware and share the same documented accuracy specifications.
Documented examples specifically include altimeters and thermistors alongside irregular tank volume as applications for custom curve linearization — since altimeters and thermistors are sensors with their own documented nonlinear response characteristics (distinct from a tank's physical shape), this indicates the documented linearization capability is general-purpose, applicable to correcting nonlinearity from the sensor itself just as much as from the physical geometry of a measured vessel.
Yes — this page documents Modbus TCP specifically as the supported Ethernet Data I/O protocol at digital address 247, while the LT Series serial variant is documented elsewhere as separately supporting Modbus RTU/ASCII and Laurel Custom ASCII; a control system needing a protocol other than Modbus TCP would need to reference the LT Series serial variant rather than this LTE Ethernet variant.
Yes, in principle — documented description specifically ties this high input impedance to minimizing load on the voltage signal being measured; in a ratiometric bridge application, drawing minimal current from the bridge output is consistent with preserving the bridge's own balance and the accuracy of the ratiometric reading, similar to how high input impedance is documented as beneficial for other sensitive DC voltage measurements across the LT/LTE family.
No — documented Extended board capability (custom curve linearization with up to 180 data points, plus rate derived from consecutive readings) is described as an additive processing feature layered on top of the underlying measurement and output path; the documented Ethernet Data I/O and analog output specifications (16-bit resolution, 0.02% output accuracy, Modbus TCP at address 247) apply the same way regardless of whether the Standard or Extended main board is selected.
Documented default scaling for the P option is specifically "4-20 mA in = 4-20 mA out," while the SG option's documented default is "0-200 mV = 0-100.00" — this indicates P (and its custom-scaling counterpart P1) is the documented option specifically intended for a 4-20 mA process signal, while SG/SG1 is documented as oriented toward millivolt-level bridge/strain gauge signals, so P1 is the more directly applicable documented choice for scaling a 4-20 mA input specifically.
Documented definition specifically describes a strapping table (also called a tank calibration chart, tank gauge chart, or dip chart) as a lookup converting a measured level into a corresponding volume — documented explanation specifically notes non-linear tanks can't have their volume calculated from level using simple mathematical equations, since volume doesn't change proportionally with level in a non-cylindrical or irregularly shaped vessel, which is specifically why a table-based conversion is documented as necessary.
Not necessarily — documented patent-level description specifically contrasts basic linear interpolation between two adjacent table entries with higher-order polynomial interpolation methods (citing third, fourth, and fifth order polynomial interpolations, specifically referencing Neville's algorithm), noting that documented testing shows these higher-order methods can provide a more accurate strap volume than simple linear interpolation between just two points.
Yes, generally — documented explanation specifically states that within each "strap" (interval between table points), volume is linearly interpolated with level, so a greater number of straps in the table is documented as directly producing more accurate volume indication; more closely spaced data points reduce the error introduced by interpolating across each individual gap.
Yes — documented field experience specifically describes most real-world dip tables as having more data points clustered specifically in regions of greatest non-linearity (such as a tank's rounded ends or dished heads), with relatively few data points needed for the straight cylindrical bulk of the vessel where volume changes linearly with level; this uneven, non-linearity-driven spacing is documented as standard practice rather than using uniform spacing throughout.
Not reliably, according to documented guidance — documented explanation specifically notes that variations in tank manufacturing make a custom strap chart developed for one particular tank necessary, since manufacturing variation between individually built tanks means even nominally identical tanks can have real dimensional differences that a shared generic strapping table wouldn't capture.
No — documented explanation specifically states that tank calibration via a strap chart is performed independent of the type of liquid in the tank, since the strapping table maps physical level to physical volume based on the tank's geometry alone; the same strap chart is documented as reusable across different liquids, since chemical composition doesn't affect the level-to-volume geometric relationship the table describes.
Documented history specifically traces the term "strapping" itself to the traditional method of wrapping a steel measuring tape (a "strap") around the outside of a storage tank at different heights to physically measure and calibrate the vessel; documented modern practice has largely replaced this manual method with laser levels and ultrasonic thickness gauges for generating the same underlying table.
Yes — documented product examples specifically describe modern level sensors accepting a strapping chart programmed directly into the sensor itself, commonly via a communication protocol such as Modbus; documented setup for this approach involves assigning a volume value to a series of known level measurements, after which the sensor uses those stored points to linearize its own continuous volume output going forward.