New Front Panel USB-C Port Coming Soon!
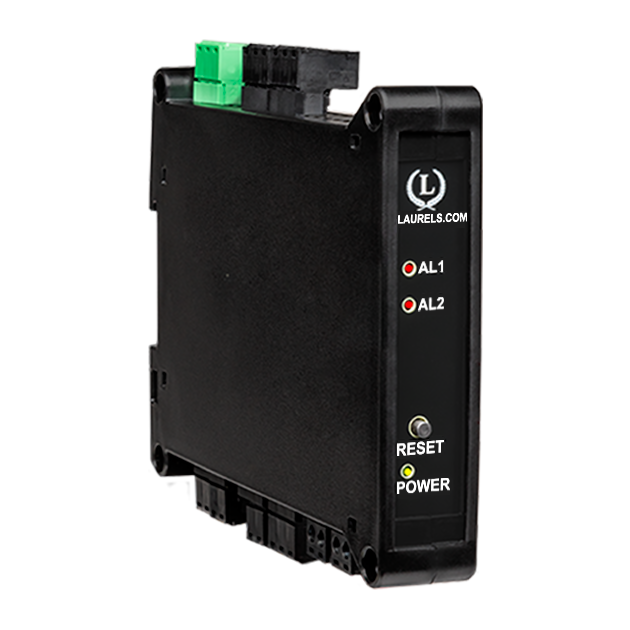
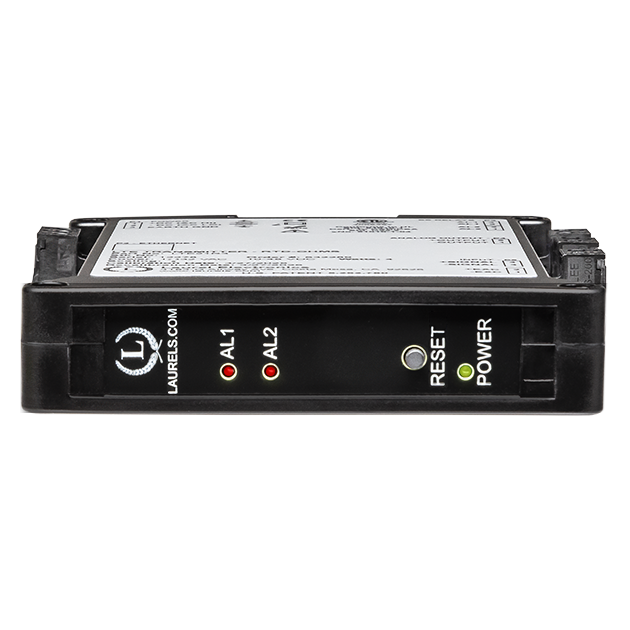
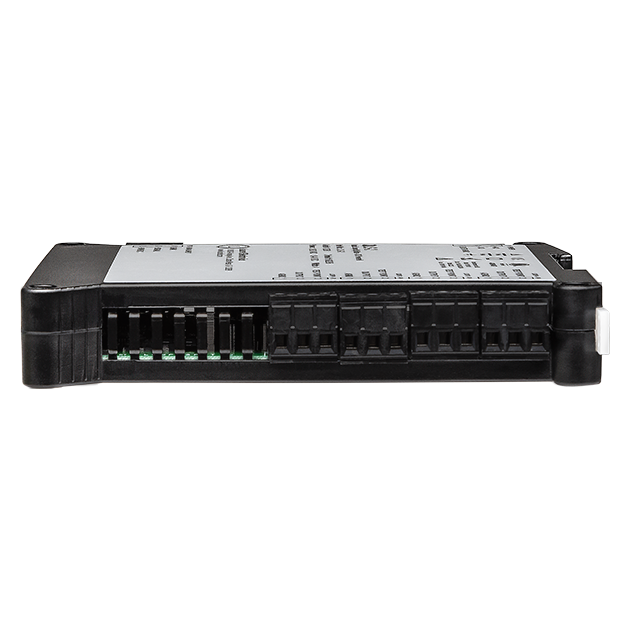
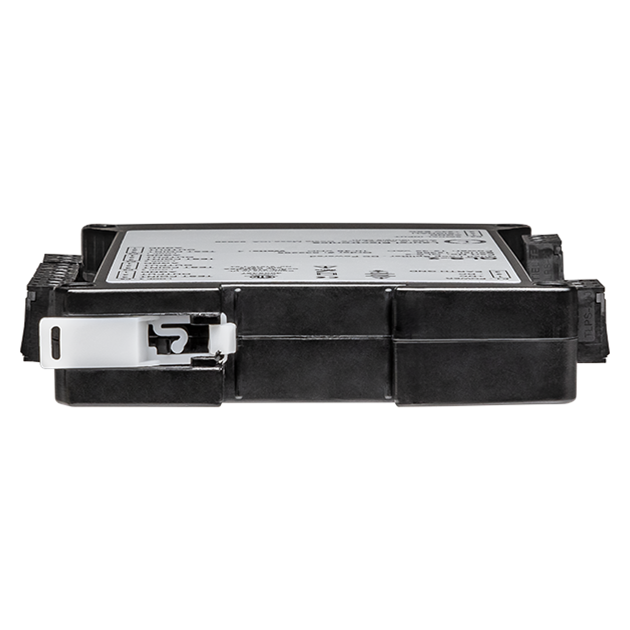
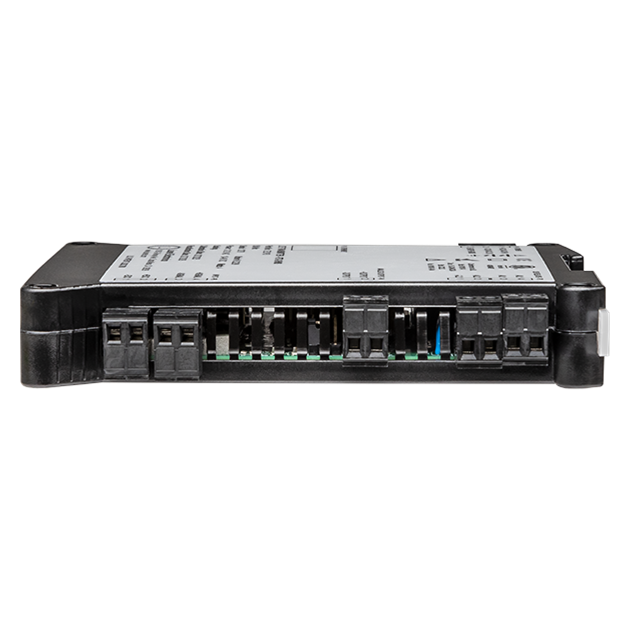
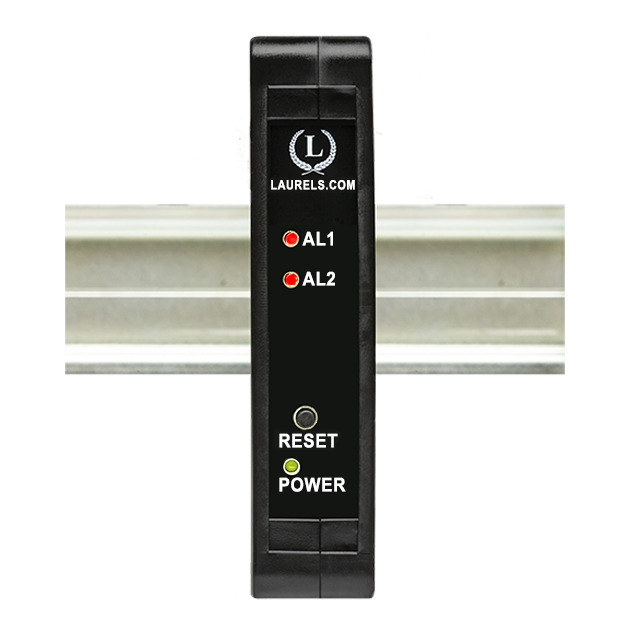
The Laureate 4-20 mA, 0-20 mA, 0-10V or -10V to +10V and RS232/RS485 output transmitter for pulse input to 4-20 mA converter and serial data output accepts totals from two independently scalable input channels from a wide range of pulse sources, such as NPN or PNP proximity switches, contact closures, digital logic, magnetic pickups down to 12 mV, or AC voltages to 250 Vac. Input pulse rates can be as high as 1 MHz.
With a Standard main board, the transmitter output can be scaled to track total (such as gallons) or rate (such as gallons per minute). Square root extraction is standard.
With an Extended main board, the transmitter can also:
The dual-channel signal conditioner used for pulse detection accepts inputs from proximity switches with PNP or NPN output, TTL or CMOS logic, magnetic pickups, contact closures, and voltage signals from 12 mV to 250 Vac. Jumper selections provide optimum operation for different sensor types and noise conditions. A built-in 5V, 10V, 12V, or 24V dc excitation supply can power proximity switches and other sensors, and eliminate the need for an external power supply.
Exceptional Accuracy and Stability. Laureate transmitters determine frequency by taking the inverse of period as measured with a calibrated quartz crystal time base. This results in extremely accurate and stable 6-digit internal readings (±999,999 counts), which are then processed in software. The analog output is generated by an ultra-linear 16-bit (65,536 step) digital-to-analog converter (DAC) for 0.02% output accuracy. The update rate of the transmitter output is a programmed gate time + 30 ms + 0-2 signal periods. For a 60 Hz signal, the update rate would be 20 per second. Such fast update rates are ideal for alarm and control.
The update rate of the transmitter output is a programmed gate time + 30 ms + 0-2 signal periods. For a 60 Hz signal, the update rate would be 20 per second. Such fast update rates are ideal for alarm and control.
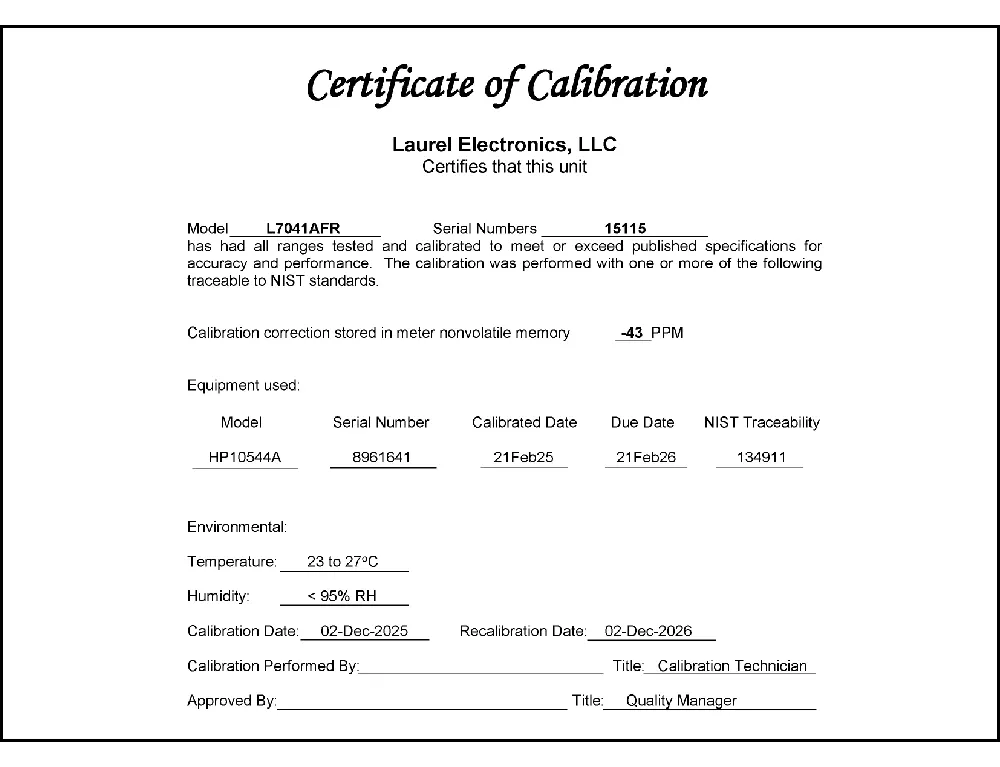
All signal conditioner board ranges are factory-calibrated, with calibration factors for each range securely stored in an onboard EEPROM. These factors can be scaled via software to accommodate external shunts, enabling field replacement of signal conditioner boards without necessitating recalibration of the associated transmitter. For optimal accuracy, factory recalibration is recommended annually. All Laurel Electronics instruments undergo factory calibration using the industry-leading Fluke calibrators, which are recalibrated yearly and certified traceable to national standards, ensuring the highest level of precision and reliability.
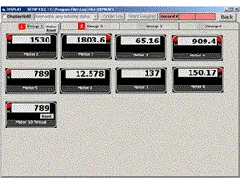
Easy USB-C Programming: Configure Laureate transmitters through the front-panel USB-C port with Laurel’s free Instrument Setup Software for Windows. Configurations can be saved to the transmitter, a PC, a file server, or a USB thumb drive. Laurel’s free Instrument Setup Software can also be used for light-duty data collection.
Peak and valley values are automatically captured. These may be displayed via Laurel's free Instrument Setup Software, which runs on a PC under MS Windows or can be transmitted as serial data.
Two control inputs (CMOS/TTL levels, logic 0 = tied to digital ground, logic 1 = open) or dry contacts that can be set to control / activate 14 transmitter commands.
An (isolated) 5, 10, 12, or 24 Vdc excitation output is standard to power transducers or two-wire transmitters. Ratiometric operation, which automatically compensates for changes in the applied excitation, is jumper selectable for applications, such as bridges, where the signal to be measured is proportional to the excitation level.

LT series DIN rail Transmitters & signal conditioners can be interfaced to a wide range of sensors and transducers using one of seven available plug-in signal conditioner boards. The transmitters duplicate the high performance (high accuracy, high read rate) and extensive programmable features of Laureate 1/8 DIN digital panel meters, counters and timers. They utilize the same signal conditioners boards, much of the same firmware, and Laurel's free Windows-based Instrument Setup Software. They come in a compact DIN rail mount package with detachable screw-clamp connectors for easy wiring.
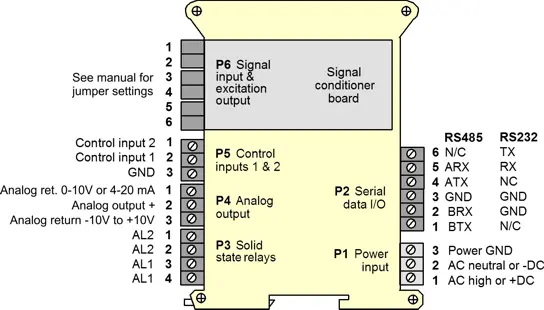
The LT series Transmitters accessible from this page include a 4-20 mA, 0-20 mA, 0-10V, or -10V to +10V analog output (isolated, user selectable), an RS232 or RS485 serial data interface (isolated, user selectable), and dual 120 mA solid state AC/DC relays (isolated). An (isolated) 5, 10, 12, or 24 Vdc transducer excitation output is included with all models other than those with a temperature or AC RMS signal conditioner.
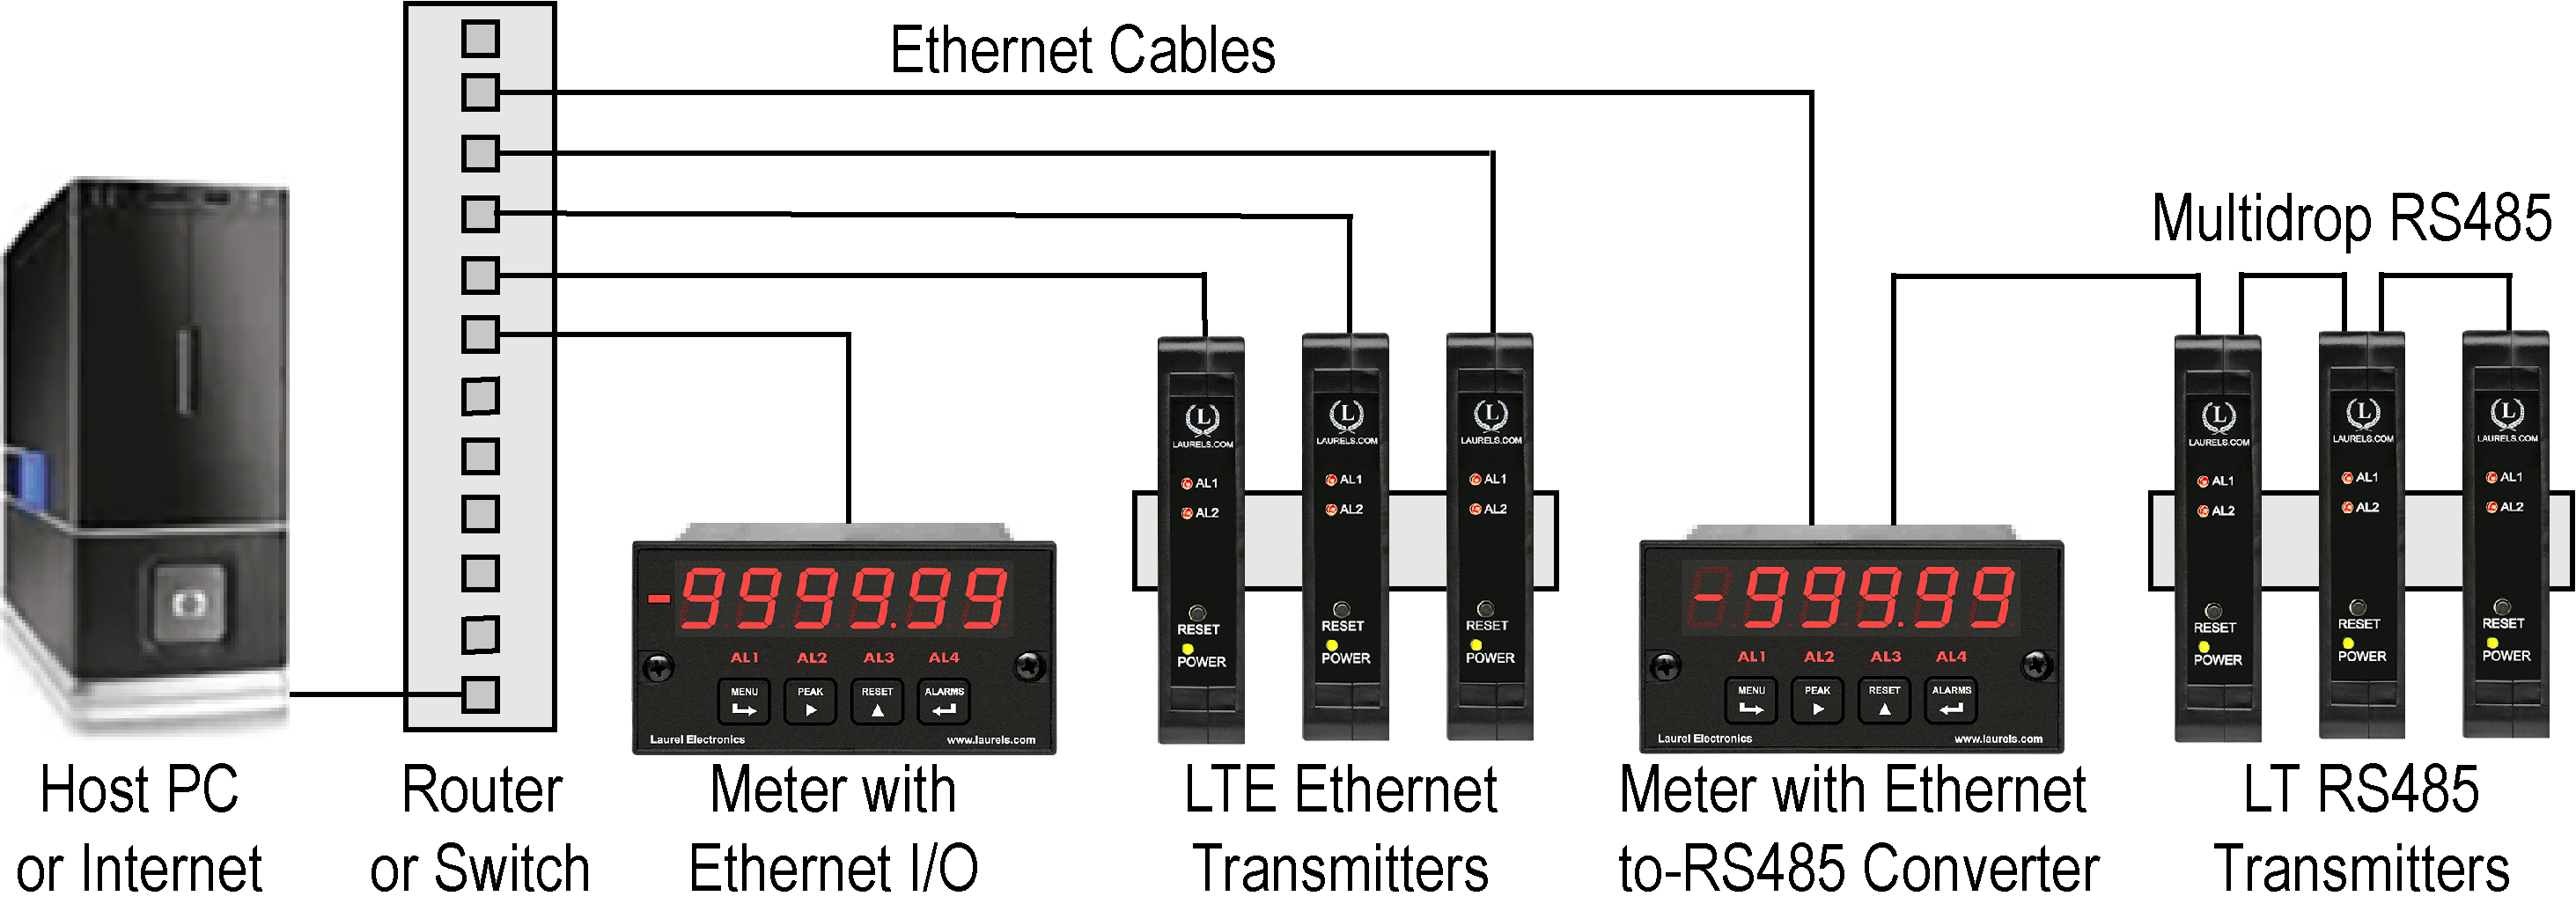
Up to 30 Laureate LT Transmitters and/or Digital Panel Meters can be configured for RS485 and daisy-chained to an LT Transmitter for seamless LAN integration. Alternatively, Laurel LTE series Ethernet transmitters can connect directly to a LAN via an Ethernet cable. Setup for both configurations is streamlined using Laurel’s free Instrument Setup Software, which simplifies node discovery and transmitter configuration.
Laureate Transmitters can be equipped with Laurel communication boards to support various interfaces and protocols. These include serial interfaces with ASCII or Modbus RTU protocols, and Ethernet interfaces with web access, ASCII, or Modbus TCP/IP protocols, ensuring versatile connectivity for your commercial applications.
| LT Transmitter Signal Input & Function | Model Series | Analog Output | RS232 & RS485 | Dual Relays | |
|---|---|---|---|---|---|
| 1 | DC Input Voltage and Current | LT-DC |  |
|
|
| 2 | AC RMS Voltage or Current | LT-RMS | |
|
|
| 3 | Process Voltage or Current | LT-P | |
|
|
| 4 | Weighing Applications | LT-WA | |
|
|
| 5 | Load Cell & Microvolt Signals | LT-WM | |
|
|
| 6 | Thermocouple (Types J, K, T, E, N, R, S) | LT-TC | |
|
|
| 7 | RTD Temperature | LT-RTD | |
|
|
| 8 | Resistance in Ohms | LT-R | |
|
|
| 9 | Frequency, Rate, Speed | LT-FR | |
|
|
| 10 | Pulse Input Totalizer | LT-FR | |
|
|
| 11 | Process Signal Totalizer | LT-VF | |
|
|
| 12 | Sum, Difference, Ratio, Product of 2 Inputs | LT-FR | |
|
|
| 13 | Batch Controller Pulse Input | LT-FR | |
|
|
| 14 | Batch Controller Analog Input | LT-FR | |
|
|
| 15 | On/Off Duty Cycle | LT-FR | |
|
|
| 16 | Stopwatch Timing for Single Events | LT-FR | |
|
|
| 17 | Average Time of Periodic Events | LT-FR | |
|
|
| 18 | AC Phase Angle and Power Factor | LT-FR | |
|
|
| 19 | Quadrature Position or Rate | LT-QD | |
|
|
| Pulse Input | ||||
|---|---|---|---|---|
| Types | AC, pulses from NPN, PNP transistors, contact closures, magnetic pickups | |||
| Signal Ground | Common ground for channels A & B. | |||
| Minimum Signal | Nine ranges from (-12 to +12 mV) to (+1.25 to +2.1V). | |||
| Maximum Signal | 250 Vac | |||
| Maximum Frequency | 1 MHz, 30 kHz, 250 Hz (selectable). | |||
| Contact Debounce | 0, 3, 50 ms (selectable). | |||
| Recalibration: All ranges are calibrated at the factory. Recalibration is recommended every 12 months. | ||||
| Analog Output (standard) | ||||
| Output Levels | 4-20 mA, 0-20 mA, 0-10 Vdc, -10 to +10Vdc (user selectable) | |||
| Compliance, 4-20 mA | 10V (0-500Ω load) | |||
| Compliance, 0-10V | 2 mA (5 kΩ or higher load) | |||
| Output Resolution | 16 bits (65,536 steps) | |||
| Output Accuracy | 0.02% of output span | |||
| Output Update Rate | Programmed gate time + 30 ms + 0-2 signal periods | |||
| Output Isolation | 250V rms working, 2.3 kV rms per 1 minute test | |||
| Serial Data Output (standard) | ||||
| Signal Types | RS232 or RS485 (half or full duplex), jumper selectable | |||
| Data Rates | 300, 600, 1200, 2400, 4800, 9600, 19200 baud | |||
| Output Isolation | 250V rms working, 2.3 kV rms per 1 min test | |||
| Serial Protocols | Modbus RTU, Modbus ASCII, Laurel ASCII | |||
| Modbus Compliance | Modbus over Serial Line Specification V1.0 (2002) | |||
| RS232/485 Connector | Screw terminals for easy daisy chaining | |||
| Digital Addresses | 247 for Modbus, 31 for Laurel ASCII | |||
| Dual Relay Output (standard) | ||||
| Relay Type | Two solid state relays, SPST, normally open, Form A | |||
| Load Rating | 120 mA at 140 Vac or 180 Vdc | |||
| Excitation Output (standard) | ||||
| 5 Vdc | 5 Vdc ± 5%, 100 mA (jumper selectable) | |||
| 10 Vdc | 10 Vdc ± 5%, 120 mA (jumper selectable) | |||
| 12 Vdc | 12 Vdc ± 5%, 100 mA (jumper selectable) | |||
| 24 Vdc | 24 Vdc ± 5%, 50 mA (jumper selectable) | |||
| Output Isolation | 50 Vdc from signal ground | |||
| Power Input | ||||
| Standard Power | 85-264 Vac or 90-300 Vdc | |||
| Low Power Option | 10-48 Vdc or 12-32 Vac | |||
| Power Frequency | DC or 47-63 Hz | |||
| Power Isolation | 250V rms working, 2.3 kV rms per 1 min test | |||
| Power Consumption at 24V | 1.5W typical, 3W with max excitation output | |||
| Environmental | ||||
| Operating Temperature | -40°C to 70°C (-40°F to 158°F) | |||
| Storage Temperature | -40°C to 85°C (-40°F to 185°F) | |||
| Relative Humidity | 95% at 40°C, non-condensing | |||
| Cooling Required | Mount transmitters with ventilation holes at top and bottom. Leave 6 mm (1/4") between transmitters, or force air with a fan. | |||
| Mechanical | ||||
| Enclosure | Rugged black polycarbonate housing material | |||
| Mounting | 35 mm rail per DIN EN 50022 | |||
| Dimensions | 129 x 104 x 22.5 mm case | |||
| Connectors | Detachable screw clamp connectors meet VDE / IEC / UL / CSA standards. RJ45 jack for Ethernet | |||
| Tightening Torque | Screw terminal connectors: 5 lb-in (0.56 Nm) | |||
| Weight | Complete transmitter: 183 g (6.5 oz) | |||
| Replacement Case Screws | ||||
| Size | 6 | |||
| Thread Pitch | 6-19 | |||
| Length | 1/2" | |||
| Head Style | Pan Head | |||
| Drive Style | Phillips | |||
| Head Diameter | 0.256-0.270 | |||
| Head Height | 0.087-0.097 | |||
| Full/Partial Thread | Full | |||
| Drive Size | 2 | |||
| Material | Steel | |||
| Finished | Black Oxide | |||
| General | ||||
| Programming | Utilize Laurel's free Instrument Setup Software, which runs on a PC under MS Windows. | |||
| Security | Lockout options available using Laurel's free Instrument Setup Software. | |||
| Warranty | 3 years parts & labor | Recalibration: All ranges are calibrated at the factory. Recalibration is recommended every 12 months. | ||
|
|
| 1/8 DIN Digital Panel Meters | DIN Rail Transmitters |
Free Downloadable Windows-based Instrument Setup (IS) software (Data Interface Board Required) for use with our programmable Digital Panel Meters, Scale Meters, Counters, Timers, Remote Displays, and Transmitters, are an easy method to set up Laureate 1/8 DIN digital panel meters, counters, timers, remote displays, and DIN-rail transmitters, as explained in the Instrument Setup Software Manual. Laureate 1/8 DIN instruments can also be set up from the front panel, as explained in their respective Owners Manuals. Instrument Setup software is of benefit whether or not the PC is connected to the instrument.
Set User Account Control (UAC) of MS Windows to "Never notifiy me" so that Instrument Setup Software can create directories. The UAC change screen can be reached as follows:
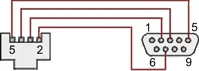
RJ11-to-DB9 cable with rear view of DB9 connector to PC
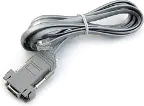
RS232 cable, meter to PC, P/N CBL01
Laureate 1/8 DIN Laureate instruments must be equipped with a serial communications board and be connected to the computer via a serial communications cable. The connection can be via RS232, RS485, USB or Ethernet. Following setup, the serial communications board may be removed from the instrument if desired. The wiring of the RS232 cable is illustrated above with end views of the two connectors.
Laureate LT Series transmitters come standard with a 3-wire serial interface, which can be jumpered for RS232 or RS485.
Laureate LTE Series transmitters come standard with an Ethernet interface.
Click on any of the reduced screens below for a full-size screen view, then click on the Back button of your browser to return to this page. The screens examples below are for a fully-loaded Series 2 Digital Panel Meter (DPM), which is connected to the PC via RS232. If the meter is a Series 1 meter (pre-2007), this is sensed by the software, and somewhat different screens are brought up. Please see Series 1 setup screens.


From the Main Menu, click on Readings if your PC is connected to the meter. A pull-down menu then offers three choices: List, Plot and Graph.


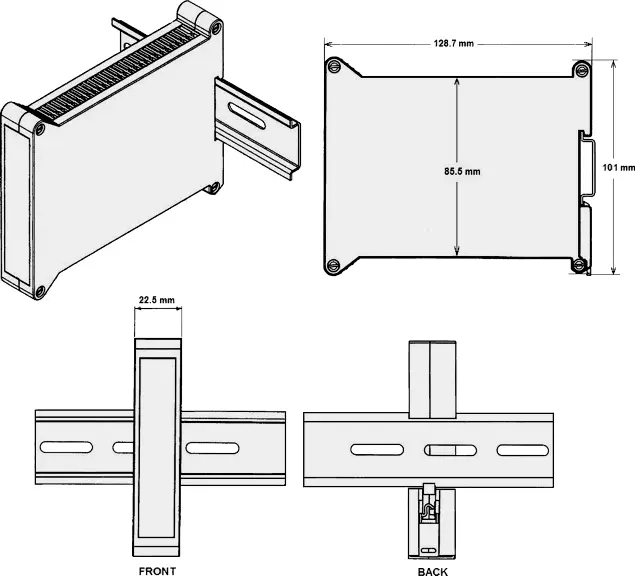
Dimensioned CAD assembly drawings in EPRT, STEP, x_t, .dwg, pdf file formats: Laureate-transmitter-case.zip (zipping prevents browser from opening CAD files as text files).
| Up/Down Totalizing | |
|---|---|
 |
Up/down totalizing is provided by a mode of the Extended totalizing transmitter where pulses are either added or subtracted on Channel A based on a direction input on Channel B. The unit can also be programmed so that counting by Channel A is inhibited by an input on Channel B. |
| Combining Two Totals | |
 |
A+B, A-B, A/B and AxB arithmetic functions are available with the Extended totalizing transmitter. A+B can sum two totals, while A-B subtracts the outflow total from inflow total. A/B ratio applied to two totals helps assure the proper mixing of components. |
| Up or Down Counting with Preset | |
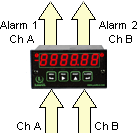 |
A single Laureate dual-channel totalizing transmitter will handle two repetitive fill operations by counting from zero up to a preset, or down from a preset to zero. The dual relay option is required. |
| Machine ON Time and Utilization | |
 |
An easy way to measure the ON time of machines is to count AC line cycles and scale the total to hours. To display machine utilization or duty cycle in percent, use the Extended totalizing transmitter. Connect Channel A to switched AC and Channel B to the AC line, and apply a 100 multiplier to the A/B ratio. |
| Custom Curve Linearization | |
 |
The Extended version of the Laureate dual channel totalizing transmitter can transmit scaled rate or total for the same channel at the push of a button, and alarm both the rate and total. The Extended version can also do curve linearization, thereby extending the working range and accuracy of flow transducers. |
CAL-Digital
Certificate of Calibration
$65.00DLS-XLOG2
XLog2 Data logging Software
$495.00CON01
CON01 Connector
$75.00CBL6
6-foot Power Cable
$41.00CBL12
12-foot Power Cable
$47.00CBL02
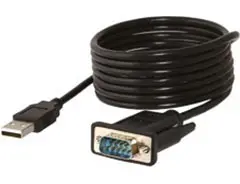
USB-to-RS232 Adapter Cable
$47.00CBL04
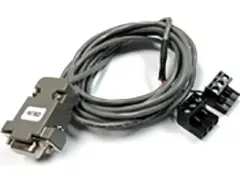
RS232 Cable for LT Transmitters
$47.00The Laureate™ LT Series DIN rail transmitter for pulse input totalizer applications accepts totals from two independently scalable input channels from a wide range of pulse sources, such as NPN or PNP proximity switches, contact closures, digital logic, magnetic pickups down to 12 mV, or AC voltages to 250 Vac. Input pulse rates can be as high as 1 MHz. With a Standard main board, output can be scaled to track total (such as gallons) or rate (such as gallons per minute); square root extraction is standard.
With an Extended main board, the transmitter can count up to a preset or down from a preset to zero (typically using the two standard solid state relays; external reset of totals is via a special three-position screw terminal connector); perform custom-curve linearization on rate or total using a curvilinear spline fit with up to 180 data points, to extend transducer range; and combine Channels A and B arithmetically so output tracks A+B (sum of two flows or totals), A-B (difference of two flows or totals), AxB (horsepower as product of force and RPM), A/B (ratio of two flows or totals), and A/B-1 (draw, or relative elongation of material between rollers).
The dual-channel signal conditioner accepts inputs from proximity switches with PNP or NPN output, TTL or CMOS logic, magnetic pickups, contact closures, and voltage signals from 12 mV to 250 Vac. Jumper selections provide optimum operation for different sensor types and noise conditions. A built-in 5V, 10V, 12V, or 24V dc excitation supply can power proximity switches and other sensors, eliminating the need for an external power supply.
Frequency is determined by taking the inverse of period as measured with a calibrated quartz crystal time base, producing extremely accurate and stable 6-digit internal readings (±999,999 counts). The analog output is generated by an ultra-linear 16-bit (65,536 step) DAC for 0.02% output accuracy. Output update rate is programmed gate time plus 30 ms plus 0-2 signal periods — for a 60 Hz signal, update rate is 20 per second, ideal for alarm and control.
All signal conditioner board ranges are factory-calibrated, with calibration factors stored in EEPROM, enabling field replacement of signal conditioner boards without necessitating recalibration of the transmitter. Factory recalibration is recommended annually.
Documented setup specifically distinguishes these two connections by purpose — Channel B connected to the continuous AC line provides a constant reference representing total elapsed time, while Channel A connected to switched AC only counts cycles while the machine is actually powered on; the A/B ratio of these two genuinely different counts is what produces a meaningful duty cycle figure, which wouldn't be possible if both channels measured the same signal.
Documented instruction specifically calls for a 100 multiplier because the raw A/B ratio (machine-on cycles divided by total line cycles) is inherently a fraction between 0 and 1 — multiplying by 100 converts that fraction into a directly readable percentage figure for the displayed and transmitted duty cycle value, rather than requiring the user to mentally convert a decimal ratio into percentage terms.
Documented description specifically frames this as counting AC line cycles directly, with the switched-AC connection serving as the "on" signal — since the AC line's own cycling (50 or 60 Hz) provides a naturally occurring, steady pulse train, no separate pulse-generating sensor is documented as necessary; the AC waveform itself is the counted signal, scaled to hours via the transmitter's scaling functions.
Documented description specifically frames Channel B's role as a direction input governing whether Channel A pulses are added or subtracted — this is consistent with a simple discrete (on/off or high/low) state input rather than requiring a continuous pulse train itself, since its function is to determine the sign of the counting operation, not to contribute its own pulse count to the total.
Documented description presents these as two separate modes of the Extended totalizing transmitter — one where Channel B controls add/subtract direction, and another where a Channel B input inhibits Channel A counting entirely — the page describes them as distinct configuration options rather than confirming they can be combined simultaneously on the same input.
The page documents external reset as a general capability tied to the up/down counting with preset functionality, without separately detailing independent per-channel reset control at that specific connector — this is documented as the mechanism for external total reset generally, with channel-specific reset behavior best confirmed against the specific configuration in use.
Documented description specifically states the dual relay option is required for this application, consistent with each relay being used to signal completion of one of the two repetitive fill operations being tracked — since the application involves monitoring two separate preset-based counts, having two independent relay outputs is what allows each fill operation's completion to be signaled and acted upon separately.
Documented capability lists square root extraction as standard on the Standard main board without separately distinguishing its application to rate versus total — since a totalized reading is fundamentally an accumulation of the (potentially square-root-corrected) rate over time, square root extraction is documented as applying at the underlying signal-conditioning stage before totalization occurs, so both the rate display and the accumulated total benefit from the same correction rather than needing separate extraction steps.
Documented phrasing specifically describes linearization as extending the working range and accuracy of flow transducers — this refers to extending the usable accurate measurement range within the transducer's own physical capability (particularly at the low end, where many flow transducers are documented elsewhere as nonlinear), not literally exceeding the transducer's physical measurement limits; linearization corrects how accurately the existing signal is interpreted, it doesn't change what the sensor can physically detect.
Documented description lists simultaneous rate/total display and the five arithmetic functions as separate Extended-board capabilities without stating they're mutually exclusive — since arithmetic functions are documented as applicable to "scaled rates" and "scaled totals" alike, and simultaneous display is documented as showing scaled rate or total for the same input, the two capabilities address different aspects of the same underlying data (what's calculated versus what's displayed) and are consistent with combined use on one Extended-board transmitter.
Documented explanation specifically describes OEE (Overall Equipment Effectiveness) as combining three separate factors — Availability (uptime versus planned time), Performance (actual speed versus ideal speed), and Quality (good parts versus total parts) — into one composite score, whereas a simple utilization percentage is documented as a narrower, single-dimension metric describing only how much of available time the machine is actually running, without capturing speed or quality losses.
No — documented industry analysis specifically notes that manual OEE tracking (using paper sheets, spreadsheets, or tracking cards) is commonly overestimated by 10-25%, which can distort improvement decisions; this documented gap between manual and automated tracking is cited as a specific reason for moving toward automated, sensor-based runtime data collection.
Yes — documented guidance specifically recommends separating planned downtime (scheduled breaks, planned maintenance) from unplanned downtime, and using consistent time windows (shift, day, week) across all machines and operations, specifically so that utilization and OEE figures remain comparable across different machines and time periods rather than being skewed by inconsistent counting rules.
Yes — one documented industry dataset specifically reports average CNC machine utilization around 25.9%, with most shops operating between roughly 17-20% and high-performing shops reaching around 60%, illustrating that even a utilization figure that sounds low in isolation may be broadly consistent with typical industry figures, while also showing substantial documented room for improvement exists between typical and high-performing operations.
No — documented guidance specifically distinguishes these: tracking downtime duration alone tells you how much time is being lost, but capturing structured reason codes (mechanical failure, tooling change, material wait, operator break, and so on) is documented as necessary to know where to focus improvement efforts; a Pareto-style analysis of downtime reasons is documented as a common technique for identifying which causes drive the majority of total losses.
Not typically — documented industry guidance cites roughly 85% as a commonly referenced world-class OEE figure in discrete manufacturing, while also documenting that most shops start well below that benchmark; this framing treats world-class OEE as an aspirational long-term target reflecting significant improvement effort, not a baseline expectation for a newly instrumented machine.
No — documented analysis specifically notes that a machine running at, for example, 90% of its rated speed doesn't look like an obvious problem in isolation, but that 10% speed loss compounds significantly when multiplied across many cycles per shift; a basic ON-time or utilization measurement documents whether the machine was running, but doesn't by itself reveal this kind of speed-based performance loss, which is why full OEE tracking documents speed as a separate, additional factor.
Not always — one documented field example specifically describes a case where automated machine-cycle data alone showed a long unexplained gap between production cycles that only became understandable when cross-referenced against separately logged operator/job data; documented guidance from this example suggests that combining automated machine data with other operational context can reveal insights that machine data alone would leave as an open question.